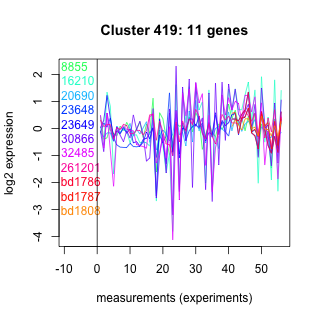
Thaps_hclust_0419 Hierarchical Clustering
Thalassiosira pseudonana
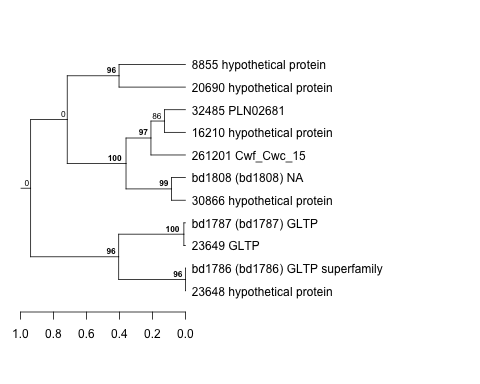
| Cluster Plot | Conditions Plot | Dendrogram |
|---|---|---|
 |
 |
 |
| GO ID | Go Term | p-value | q-value | Cluster |
|---|---|---|---|---|
| GO:0006562 | proline catabolism | 0.000413479 | 1 | Thaps_hclust_0419 |
| GO:0006537 | glutamate biosynthesis | 0.00165341 | 1 | Thaps_hclust_0419 |
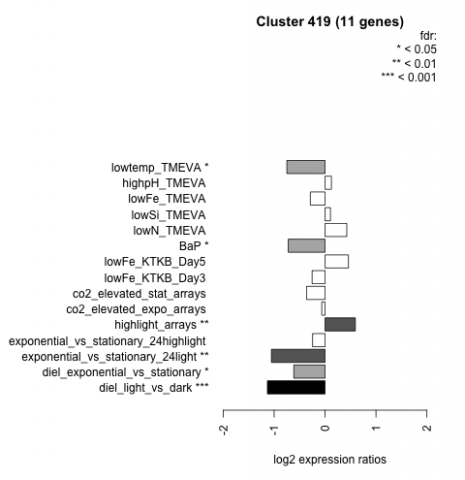
| Condition | Condition | Difference | FDR |
|---|---|---|---|
| diel_light_vs_dark | diel_light_vs_dark | -1.130 | 0.000485 |
| lowFe_KTKB_Day3 | lowFe_KTKB_Day3 | -0.254 | 0.447 |
| lowFe_KTKB_Day5 | lowFe_KTKB_Day5 | 0.459 | 0.0901 |
| BaP | BaP | -0.723 | 0.0132 |
| exponential_vs_stationary_24highlight | exponential_vs_stationary_24highlight | -0.245 | 0.0817 |
| co2_elevated_stat_arrays | co2_elevated_stat_arrays | -0.364 | 0.189 |
| lowtemp_TMEVA | lowtemp_TMEVA | -0.750 | 0.0359 |
| highpH_TMEVA | highpH_TMEVA | 0.125 | 0.585 |
| co2_elevated_expo_arrays | co2_elevated_expo_arrays | -0.065 | 0.888 |
| lowFe_TMEVA | lowFe_TMEVA | -0.289 | 0.399 |
| exponential_vs_stationary_24light | exponential_vs_stationary_24light | -1.050 | 0.00802 |
| lowN_TMEVA | lowN_TMEVA | 0.427 | 0.31 |
| diel_exponential_vs_stationary | diel_exponential_vs_stationary | -0.613 | 0.0135 |
| lowSi_TMEVA | lowSi_TMEVA | 0.106 | 0.983 |
| highlight_arrays | highlight_arrays | 0.595 | 0.00517 |