Thaps_hclust_0450 Hierarchical Clustering
Thalassiosira pseudonana
| Cluster Plot | Conditions Plot | Dendrogram |
|---|---|---|
 |
 |
 |
| GO ID | Go Term | p-value | q-value | Cluster |
|---|---|---|---|---|
| GO:0006355 | regulation of transcription, DNA-dependent | 0.0115414 | 1 | Thaps_hclust_0450 |
| GO:0006468 | protein amino acid phosphorylation | 0.1264 | 1 | Thaps_hclust_0450 |
|
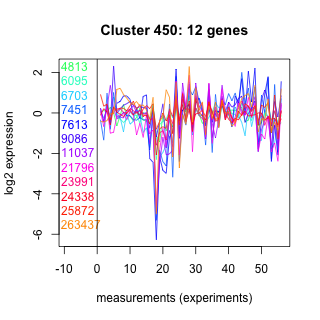
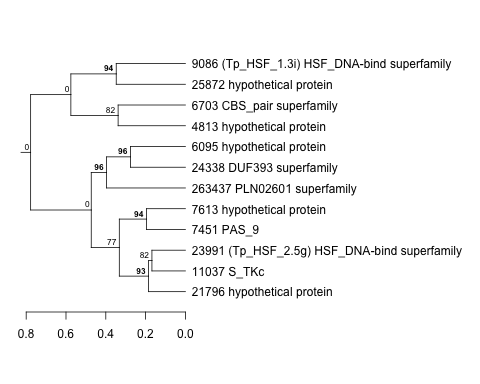
4813 : hypothetical protein |
7451 : PAS_9 |
11037 : S_TKc |
24338 : DUF393 superfamily |
|
6095 : hypothetical protein |
7613 : hypothetical protein |
21796 : hypothetical protein |
25872 : hypothetical protein |
|
6703 : CBS_pair superfamily |
9086 : (Tp_HSF_1.3i) HSF_DNA-bind superfamily |
23991 : (Tp_HSF_2.5g) HSF_DNA-bind superfamily |
263437 : PLN02601 superfamily |
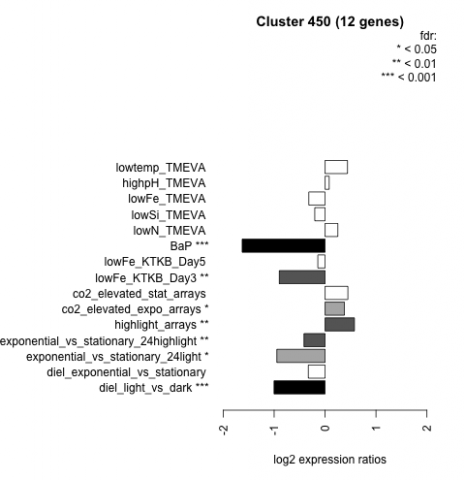
| Condition | Condition | Difference | FDR |
|---|---|---|---|
| diel_light_vs_dark | diel_light_vs_dark | -1.000 | 0.000485 |
| lowFe_KTKB_Day3 | lowFe_KTKB_Day3 | -0.898 | 0.00299 |
| lowFe_KTKB_Day5 | lowFe_KTKB_Day5 | -0.142 | 0.614 |
| BaP | BaP | -1.630 | 0.00037 |
| exponential_vs_stationary_24highlight | exponential_vs_stationary_24highlight | -0.414 | 0.00323 |
| co2_elevated_stat_arrays | co2_elevated_stat_arrays | 0.449 | 0.0885 |
| lowtemp_TMEVA | lowtemp_TMEVA | 0.440 | 0.186 |
| highpH_TMEVA | highpH_TMEVA | 0.080 | 0.741 |
| co2_elevated_expo_arrays | co2_elevated_expo_arrays | 0.380 | 0.0218 |
| lowFe_TMEVA | lowFe_TMEVA | -0.320 | 0.349 |
| exponential_vs_stationary_24light | exponential_vs_stationary_24light | -0.947 | 0.015 |
| lowN_TMEVA | lowN_TMEVA | 0.250 | 0.558 |
| diel_exponential_vs_stationary | diel_exponential_vs_stationary | -0.328 | 0.151 |
| lowSi_TMEVA | lowSi_TMEVA | -0.202 | 0.861 |
| highlight_arrays | highlight_arrays | 0.577 | 0.00254 |