Thaps_hclust_0484 Hierarchical Clustering
Thalassiosira pseudonana
| Cluster Plot | Conditions Plot | Dendrogram |
|---|---|---|
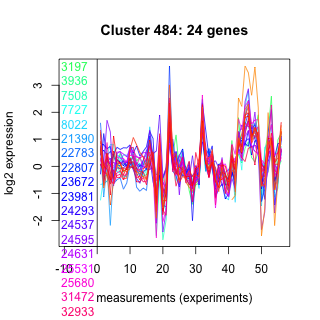 |
 |
 |
| GO ID | Go Term | p-value | q-value | Cluster |
|---|---|---|---|---|
| GO:0006470 | protein amino acid dephosphorylation | 0.0213348 | 1 | Thaps_hclust_0484 |
| GO:0006468 | protein amino acid phosphorylation | 0.164893 | 1 | Thaps_hclust_0484 |
| GO:0006508 | proteolysis and peptidolysis | 0.217787 | 1 | Thaps_hclust_0484 |
| GO:0006355 | regulation of transcription, DNA-dependent | 0.230778 | 1 | Thaps_hclust_0484 |
|
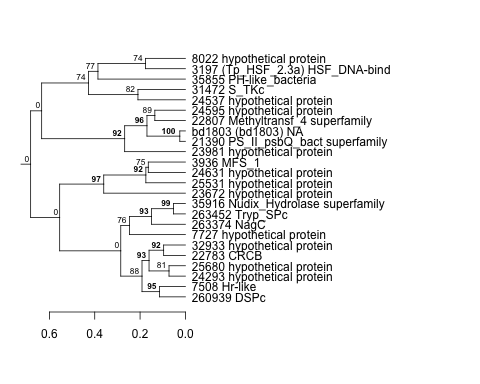
3197 : (Tp_HSF_2.3a) HSF_DNA-bind |
22783 : CRCB |
24595 : hypothetical protein |
35855 : PH-like_bacteria |
|
3936 : MFS_1 |
22807 : Methyltransf_4 superfamily |
24631 : hypothetical protein |
35916 : Nudix_Hydrolase superfamily |
|
7508 : Hr-like |
23672 : hypothetical protein |
25531 : hypothetical protein |
260939 : DSPc |
|
7727 : hypothetical protein |
23981 : hypothetical protein |
25680 : hypothetical protein |
263374 : NagC |
|
8022 : hypothetical protein |
24293 : hypothetical protein |
31472 : S_TKc |
263452 : Tryp_SPc |
|
21390 : PS_II_psbQ_bact superfamily |
24537 : hypothetical protein |
32933 : hypothetical protein |
bd1803 : (bd1803) NA |
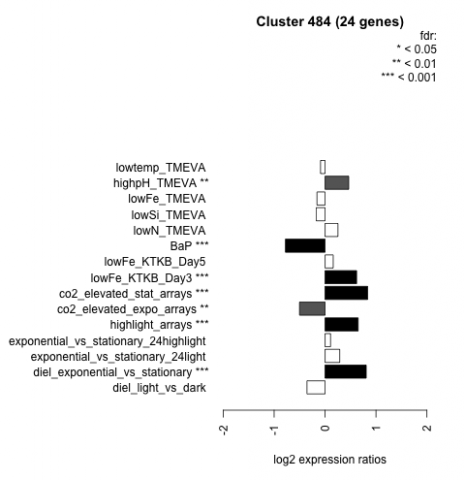
| Condition | Condition | Difference | FDR |
|---|---|---|---|
| diel_light_vs_dark | diel_light_vs_dark | -0.355 | 0.0516 |
| lowFe_KTKB_Day3 | lowFe_KTKB_Day3 | 0.620 | 0.000862 |
| lowFe_KTKB_Day5 | lowFe_KTKB_Day5 | 0.160 | 0.396 |
| BaP | BaP | -0.778 | 0.00037 |
| exponential_vs_stationary_24highlight | exponential_vs_stationary_24highlight | 0.108 | 0.274 |
| co2_elevated_stat_arrays | co2_elevated_stat_arrays | 0.836 | 0.000658 |
| lowtemp_TMEVA | lowtemp_TMEVA | -0.089 | 0.74 |
| highpH_TMEVA | highpH_TMEVA | 0.465 | 0.00197 |
| co2_elevated_expo_arrays | co2_elevated_expo_arrays | -0.501 | 0.00139 |
| lowFe_TMEVA | lowFe_TMEVA | -0.158 | 0.619 |
| exponential_vs_stationary_24light | exponential_vs_stationary_24light | 0.288 | 0.353 |
| lowN_TMEVA | lowN_TMEVA | 0.253 | 0.462 |
| diel_exponential_vs_stationary | diel_exponential_vs_stationary | 0.808 | 0.000602 |
| lowSi_TMEVA | lowSi_TMEVA | -0.174 | 0.921 |
| highlight_arrays | highlight_arrays | 0.649 | 0.000442 |