Hierarchical Clusters
Displaying 1101 - 1200 of 7500
| Title | Cluster Plot | Dendrogram | e-value | e-value | e-value | Condition | Condition FDR | Condition Difference |
|---|---|---|---|---|---|---|---|---|
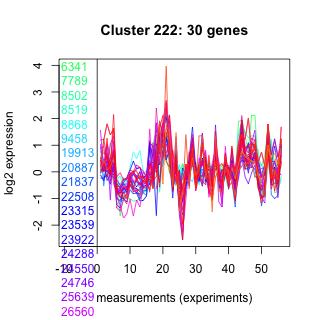
| Thaps_hclust_0222 |
 |
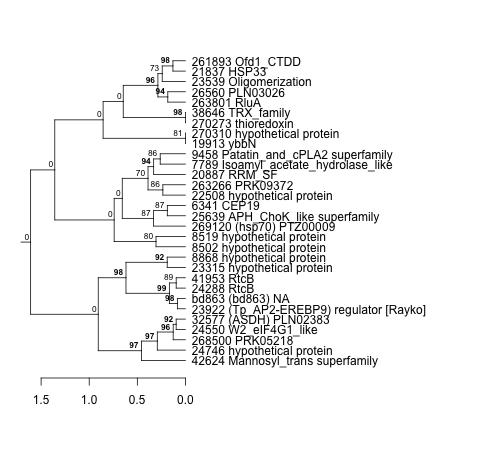 |
0.0000000000016 |
0.000000011 |
0.0008 |
BaP | 0.000370 | 1.03 |
| Thaps_hclust_0222 |
|
|
0.0000000000016 |
0.000000011 |
0.0008 |
exponential_vs_stationary_24highlight | 0.706000 | -0.0372 |
| Thaps_hclust_0222 |
|
|
0.0000000000016 |
0.000000011 |
0.0008 |
co2_elevated_stat_arrays | 0.000658 | 0.989 |
| Thaps_hclust_0222 |
|
|
0.0000000000016 |
0.000000011 |
0.0008 |
lowtemp_TMEVA | 0.002670 | 0.642 |
| Thaps_hclust_0222 |
|
|
0.0000000000016 |
0.000000011 |
0.0008 |
highpH_TMEVA | 0.002530 | 0.392 |
| Thaps_hclust_0222 |
|
|
0.0000000000016 |
0.000000011 |
0.0008 |
co2_elevated_expo_arrays | 0.969000 | -0.0252 |
| Thaps_hclust_0222 |
|
|
0.0000000000016 |
0.000000011 |
0.0008 |
lowFe_TMEVA | 0.158000 | 0.326 |
| Thaps_hclust_0222 |
|
|
0.0000000000016 |
0.000000011 |
0.0008 |
exponential_vs_stationary_24light | 0.074100 | -0.464 |
| Thaps_hclust_0222 |
|
|
0.0000000000016 |
0.000000011 |
0.0008 |
lowN_TMEVA | 0.117000 | 0.429 |
| Thaps_hclust_0222 |
|
|
0.0000000000016 |
0.000000011 |
0.0008 |
diel_exponential_vs_stationary | 0.937000 | 0.017 |
| Thaps_hclust_0222 |
|
|
0.0000000000016 |
0.000000011 |
0.0008 |
lowSi_TMEVA | 0.839000 | 0.22 |
| Thaps_hclust_0222 |
|
|
0.0000000000016 |
0.000000011 |
0.0008 |
highlight_arrays | 0.007670 | 0.334 |
| Thaps_hclust_0222 |
|
|
0.0000000000016 |
0.000000011 |
0.0008 |
diel_light_vs_dark | 0.686000 | -0.0891 |
| Title | Cluster Plot | Dendrogram | e-value | e-value | e-value | Condition | Condition FDR | Condition Difference |
|---|---|---|---|---|---|---|---|---|
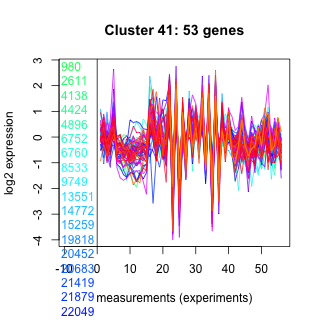
| Thaps_hclust_0041 |
 |
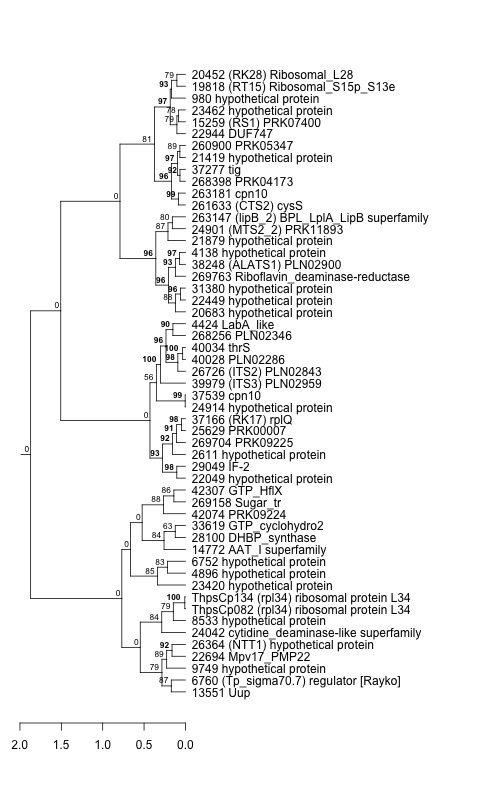 |
4.4e-38 |
0.000000011 |
0.0000042 |
co2_elevated_stat_arrays | 0.113000 | 0.258 |
| Thaps_hclust_0041 |
|
|
4.4e-38 |
0.000000011 |
0.0000042 |
lowtemp_TMEVA | 0.000735 | 0.575 |
| Thaps_hclust_0041 |
|
|
4.4e-38 |
0.000000011 |
0.0000042 |
highpH_TMEVA | 0.680000 | 0.0558 |
| Thaps_hclust_0041 |
|
|
4.4e-38 |
0.000000011 |
0.0000042 |
co2_elevated_expo_arrays | 0.068700 | 0.178 |
| Thaps_hclust_0041 |
|
|
4.4e-38 |
0.000000011 |
0.0000042 |
lowFe_TMEVA | 0.951000 | -0.0295 |
| Thaps_hclust_0041 |
|
|
4.4e-38 |
0.000000011 |
0.0000042 |
exponential_vs_stationary_24light | 0.343000 | 0.223 |
| Thaps_hclust_0041 |
|
|
4.4e-38 |
0.000000011 |
0.0000042 |
lowN_TMEVA | 0.515000 | -0.194 |
| Thaps_hclust_0041 |
|
|
4.4e-38 |
0.000000011 |
0.0000042 |
diel_exponential_vs_stationary | 0.976000 | 0.00591 |
| Thaps_hclust_0041 |
|
|
4.4e-38 |
0.000000011 |
0.0000042 |
lowSi_TMEVA | 0.976000 | -0.149 |
| Thaps_hclust_0041 |
|
|
4.4e-38 |
0.000000011 |
0.0000042 |
highlight_arrays | 0.028100 | -0.217 |
| Thaps_hclust_0041 |
|
|
4.4e-38 |
0.000000011 |
0.0000042 |
diel_light_vs_dark | 0.000485 | -1.94 |
| Thaps_hclust_0041 |
|
|
4.4e-38 |
0.000000011 |
0.0000042 |
lowFe_KTKB_Day3 | 0.000862 | 0.583 |
| Title | Cluster Plot | Dendrogram | e-value | e-value | e-value | Condition | Condition FDR | Condition Difference |
|---|---|---|---|---|---|---|---|---|
| Thaps_hclust_0058 |
 |
 |
0.000000037 |
0.000000014 |
0.00000069 |
co2_elevated_expo_arrays | 0.563000 | 0.105 |
| Thaps_hclust_0058 |
|
|
0.000000037 |
0.000000014 |
0.00000069 |
lowFe_TMEVA | 0.001040 | -0.637 |
| Thaps_hclust_0058 |
|
|
0.000000037 |
0.000000014 |
0.00000069 |
exponential_vs_stationary_24light | 0.000581 | 2.2 |
| Thaps_hclust_0058 |
|
|
0.000000037 |
0.000000014 |
0.00000069 |
lowN_TMEVA | 0.013600 | -0.527 |
| Thaps_hclust_0058 |
|
|
0.000000037 |
0.000000014 |
0.00000069 |
diel_exponential_vs_stationary | 0.000602 | 2.64 |
| Thaps_hclust_0058 |
|
|
0.000000037 |
0.000000014 |
0.00000069 |
lowSi_TMEVA | 0.001350 | -0.989 |
| Thaps_hclust_0058 |
|
|
0.000000037 |
0.000000014 |
0.00000069 |
highlight_arrays | 0.000442 | -1.16 |
| Thaps_hclust_0058 |
|
|
0.000000037 |
0.000000014 |
0.00000069 |
diel_light_vs_dark | 0.636000 | 0.0822 |
| Thaps_hclust_0058 |
|
|
0.000000037 |
0.000000014 |
0.00000069 |
lowFe_KTKB_Day3 | 0.106000 | -0.242 |
| Thaps_hclust_0058 |
|
|
0.000000037 |
0.000000014 |
0.00000069 |
lowFe_KTKB_Day5 | 0.646000 | -0.0712 |
| Thaps_hclust_0058 |
|
|
0.000000037 |
0.000000014 |
0.00000069 |
BaP | 0.268000 | 0.163 |
| Thaps_hclust_0058 |
|
|
0.000000037 |
0.000000014 |
0.00000069 |
exponential_vs_stationary_24highlight | 0.000526 | 0.403 |
| Thaps_hclust_0058 |
|
|
0.000000037 |
0.000000014 |
0.00000069 |
co2_elevated_stat_arrays | 0.724000 | 0.0915 |
| Thaps_hclust_0058 |
|
|
0.000000037 |
0.000000014 |
0.00000069 |
lowtemp_TMEVA | 0.000735 | -0.976 |
| Thaps_hclust_0058 |
|
|
0.000000037 |
0.000000014 |
0.00000069 |
highpH_TMEVA | 0.731000 | 0.0511 |
| Title | Cluster Plot | Dendrogram | e-value | e-value | e-value | Condition | Condition FDR | Condition Difference |
|---|---|---|---|---|---|---|---|---|
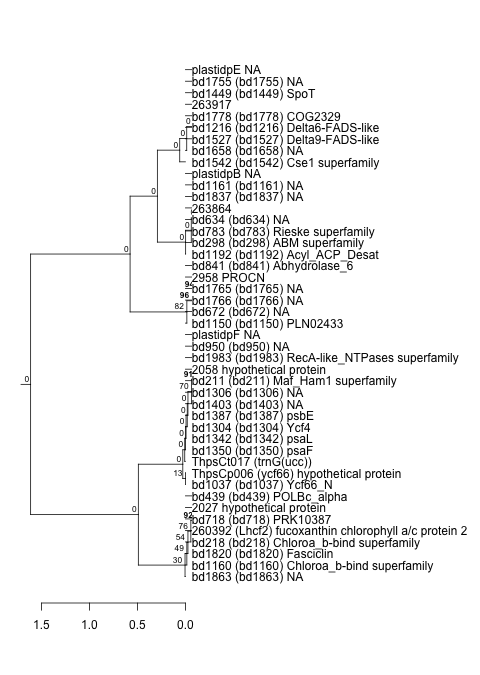
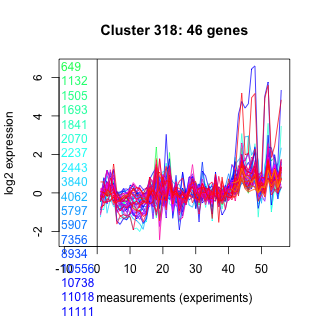
| Thaps_hclust_0318 |
 |
 |
1.1e-17 |
0.000000015 |
0.0000081 |
diel_light_vs_dark | 0.055300 | -0.248 |
| Thaps_hclust_0318 |
|
|
1.1e-17 |
0.000000015 |
0.0000081 |
lowFe_KTKB_Day3 | 0.294000 | 0.168 |
| Thaps_hclust_0318 |
|
|
1.1e-17 |
0.000000015 |
0.0000081 |
lowFe_KTKB_Day5 | 0.906000 | -0.0193 |
| Thaps_hclust_0318 |
|
|
1.1e-17 |
0.000000015 |
0.0000081 |
BaP | 0.288000 | 0.155 |
| Thaps_hclust_0318 |
|
|
1.1e-17 |
0.000000015 |
0.0000081 |
exponential_vs_stationary_24highlight | 0.000526 | -0.339 |
| Thaps_hclust_0318 |
|
|
1.1e-17 |
0.000000015 |
0.0000081 |
co2_elevated_stat_arrays | 0.000658 | 0.784 |
| Thaps_hclust_0318 |
|
|
1.1e-17 |
0.000000015 |
0.0000081 |
lowtemp_TMEVA | 0.184000 | 0.227 |
| Thaps_hclust_0318 |
|
|
1.1e-17 |
0.000000015 |
0.0000081 |
highpH_TMEVA | 0.005060 | -0.3 |
| Thaps_hclust_0318 |
|
|
1.1e-17 |
0.000000015 |
0.0000081 |
co2_elevated_expo_arrays | 0.068800 | 0.187 |
| Thaps_hclust_0318 |
|
|
1.1e-17 |
0.000000015 |
0.0000081 |
lowFe_TMEVA | 0.943000 | -0.034 |
| Thaps_hclust_0318 |
|
|
1.1e-17 |
0.000000015 |
0.0000081 |
exponential_vs_stationary_24light | 0.000581 | -0.668 |
| Thaps_hclust_0318 |
|
|
1.1e-17 |
0.000000015 |
0.0000081 |
lowN_TMEVA | 0.515000 | 0.196 |
| Thaps_hclust_0318 |
|
|
1.1e-17 |
0.000000015 |
0.0000081 |
diel_exponential_vs_stationary | 0.896000 | -0.0219 |
| Thaps_hclust_0318 |
|
|
1.1e-17 |
0.000000015 |
0.0000081 |
lowSi_TMEVA | 0.947000 | 0.171 |
| Thaps_hclust_0318 |
|
|
1.1e-17 |
0.000000015 |
0.0000081 |
highlight_arrays | 0.253000 | 0.128 |
| Title | Cluster Plot | Dendrogram | e-value | e-value | e-value | Condition | Condition FDR | Condition Difference |
|---|---|---|---|---|---|---|---|---|
| Thaps_hclust_0048 |
 |
 |
4.8e-17 |
0.000000018 |
0.0000097 |
co2_elevated_expo_arrays | 0.617000 | -0.106 |
| Thaps_hclust_0048 |
|
|
4.8e-17 |
0.000000018 |
0.0000097 |
lowFe_TMEVA | 0.626000 | -0.143 |
| Thaps_hclust_0048 |
|
|
4.8e-17 |
0.000000018 |
0.0000097 |
exponential_vs_stationary_24light | 0.000581 | 1.15 |
| Thaps_hclust_0048 |
|
|
4.8e-17 |
0.000000018 |
0.0000097 |
lowN_TMEVA | 0.011400 | -0.651 |
| Thaps_hclust_0048 |
|
|
4.8e-17 |
0.000000018 |
0.0000097 |
diel_exponential_vs_stationary | 0.000602 | 0.593 |
| Thaps_hclust_0048 |
|
|
4.8e-17 |
0.000000018 |
0.0000097 |
lowSi_TMEVA | 0.012900 | -0.745 |
| Thaps_hclust_0048 |
|
|
4.8e-17 |
0.000000018 |
0.0000097 |
highlight_arrays | 0.000442 | -0.551 |
| Thaps_hclust_0048 |
|
|
4.8e-17 |
0.000000018 |
0.0000097 |
diel_light_vs_dark | 0.000485 | -0.675 |
| Thaps_hclust_0048 |
|
|
4.8e-17 |
0.000000018 |
0.0000097 |
lowFe_KTKB_Day3 | 0.000862 | 1.25 |
| Thaps_hclust_0048 |
|
|
4.8e-17 |
0.000000018 |
0.0000097 |
lowFe_KTKB_Day5 | 0.001320 | 0.84 |
| Thaps_hclust_0048 |
|
|
4.8e-17 |
0.000000018 |
0.0000097 |
BaP | 1.000000 | 0.000608 |
| Thaps_hclust_0048 |
|
|
4.8e-17 |
0.000000018 |
0.0000097 |
exponential_vs_stationary_24highlight | 0.000526 | 0.349 |
| Thaps_hclust_0048 |
|
|
4.8e-17 |
0.000000018 |
0.0000097 |
co2_elevated_stat_arrays | 0.001700 | 0.528 |
| Thaps_hclust_0048 |
|
|
4.8e-17 |
0.000000018 |
0.0000097 |
lowtemp_TMEVA | 0.000735 | 0.883 |
| Thaps_hclust_0048 |
|
|
4.8e-17 |
0.000000018 |
0.0000097 |
highpH_TMEVA | 0.467000 | -0.105 |
| Title | Cluster Plot | Dendrogram | e-value | e-value | e-value | Condition | Condition FDR | Condition Difference |
|---|---|---|---|---|---|---|---|---|
| Thaps_hclust_0117 |
 |
 |
0.0000000000002 |
0.000000021 |
0.00000045 |
BaP | 0.002730 | -0.637 |
| Thaps_hclust_0117 |
|
|
0.0000000000002 |
0.000000021 |
0.00000045 |
exponential_vs_stationary_24highlight | 0.000526 | -1.24 |
| Thaps_hclust_0117 |
|
|
0.0000000000002 |
0.000000021 |
0.00000045 |
co2_elevated_stat_arrays | 0.000658 | 0.91 |
| Thaps_hclust_0117 |
|
|
0.0000000000002 |
0.000000021 |
0.00000045 |
lowtemp_TMEVA | 0.036400 | -0.548 |
| Thaps_hclust_0117 |
|
|
0.0000000000002 |
0.000000021 |
0.00000045 |
highpH_TMEVA | 0.000725 | 1.23 |
| Thaps_hclust_0117 |
|
|
0.0000000000002 |
0.000000021 |
0.00000045 |
co2_elevated_expo_arrays | 0.001390 | 0.788 |
| Thaps_hclust_0117 |
|
|
0.0000000000002 |
0.000000021 |
0.00000045 |
lowFe_TMEVA | 0.001040 | 0.941 |
| Thaps_hclust_0117 |
|
|
0.0000000000002 |
0.000000021 |
0.00000045 |
exponential_vs_stationary_24light | 0.000581 | -2.19 |
| Thaps_hclust_0117 |
|
|
0.0000000000002 |
0.000000021 |
0.00000045 |
lowN_TMEVA | 0.001190 | 1.73 |
| Thaps_hclust_0117 |
|
|
0.0000000000002 |
0.000000021 |
0.00000045 |
diel_exponential_vs_stationary | 0.001110 | -0.635 |
| Thaps_hclust_0117 |
|
|
0.0000000000002 |
0.000000021 |
0.00000045 |
lowSi_TMEVA | 0.248000 | -0.559 |
| Thaps_hclust_0117 |
|
|
0.0000000000002 |
0.000000021 |
0.00000045 |
highlight_arrays | 0.000442 | 1.78 |
| Thaps_hclust_0117 |
|
|
0.0000000000002 |
0.000000021 |
0.00000045 |
diel_light_vs_dark | 0.007840 | -0.519 |
| Thaps_hclust_0117 |
|
|
0.0000000000002 |
0.000000021 |
0.00000045 |
lowFe_KTKB_Day3 | 0.093700 | -0.399 |
| Thaps_hclust_0117 |
|
|
0.0000000000002 |
0.000000021 |
0.00000045 |
lowFe_KTKB_Day5 | 0.646000 | 0.101 |
| Title | Cluster Plot | Dendrogram | e-value | e-value | e-value | Condition | Condition FDR | Condition Difference |
|---|---|---|---|---|---|---|---|---|
| Thaps_hclust_0062 |
 |
 |
0.000000026 |
0.000000021 |
0.000000000021 |
diel_exponential_vs_stationary | 0.493000 | 0.232 |
| Thaps_hclust_0062 |
|
|
0.000000026 |
0.000000021 |
0.000000000021 |
lowSi_TMEVA | 1.000000 | |
| Thaps_hclust_0062 |
|
|
0.000000026 |
0.000000021 |
0.000000000021 |
highlight_arrays | 0.074100 | -0.513 |
| Thaps_hclust_0062 |
|
|
0.000000026 |
0.000000021 |
0.000000000021 |
diel_light_vs_dark | 0.003420 | -1.09 |
| Thaps_hclust_0062 |
|
|
0.000000026 |
0.000000021 |
0.000000000021 |
lowFe_KTKB_Day3 | 1.000000 | |
| Thaps_hclust_0062 |
|
|
0.000000026 |
0.000000021 |
0.000000000021 |
lowFe_KTKB_Day5 | 1.000000 | |
| Thaps_hclust_0062 |
|
|
0.000000026 |
0.000000021 |
0.000000000021 |
BaP | 1.000000 | |
| Thaps_hclust_0062 |
|
|
0.000000026 |
0.000000021 |
0.000000000021 |
exponential_vs_stationary_24highlight | 0.832000 | 0.047 |
| Thaps_hclust_0062 |
|
|
0.000000026 |
0.000000021 |
0.000000000021 |
co2_elevated_stat_arrays | 0.000658 | 1.37 |
| Thaps_hclust_0062 |
|
|
0.000000026 |
0.000000021 |
0.000000000021 |
lowtemp_TMEVA | 1.000000 | |
| Thaps_hclust_0062 |
|
|
0.000000026 |
0.000000021 |
0.000000000021 |
highpH_TMEVA | 1.000000 | |
| Thaps_hclust_0062 |
|
|
0.000000026 |
0.000000021 |
0.000000000021 |
co2_elevated_expo_arrays | 0.001390 | 0.718 |
| Thaps_hclust_0062 |
|
|
0.000000026 |
0.000000021 |
0.000000000021 |
lowFe_TMEVA | 1.000000 | |
| Thaps_hclust_0062 |
|
|
0.000000026 |
0.000000021 |
0.000000000021 |
exponential_vs_stationary_24light | 0.829000 | 0.137 |
| Thaps_hclust_0062 |
|
|
0.000000026 |
0.000000021 |
0.000000000021 |
lowN_TMEVA | 1.000000 |