Hierarchical Clusters
Displaying 1301 - 1400 of 7500
| Title | Cluster Plot | Dendrogram | e-value | e-value | e-value | Condition | Condition FDR | Condition Difference |
|---|---|---|---|---|---|---|---|---|
| Thaps_hclust_0103 |
 |
 |
3.4 |
4.8 |
21 |
diel_exponential_vs_stationary | 0.493000 | 0.161 |
| Thaps_hclust_0103 |
|
|
3.4 |
4.8 |
21 |
lowSi_TMEVA | 0.854000 | -0.206 |
| Thaps_hclust_0103 |
|
|
3.4 |
4.8 |
21 |
highlight_arrays | 0.567000 | -0.115 |
| Title | Cluster Plot | Dendrogram | e-value | e-value | e-value | Condition | Condition FDR | Condition Difference |
|---|---|---|---|---|---|---|---|---|
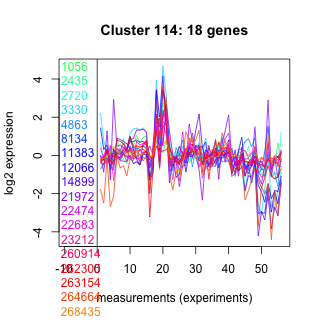
| Thaps_hclust_0114 |
 |
 |
0.086 |
4.8 |
3.2 |
highpH_TMEVA | 0.964000 | -0.0143 |
| Thaps_hclust_0114 |
|
|
0.086 |
4.8 |
3.2 |
co2_elevated_expo_arrays | 0.443000 | 0.152 |
| Title | Cluster Plot | Dendrogram | e-value | e-value | e-value | Condition | Condition FDR | Condition Difference |
|---|---|---|---|---|---|---|---|---|
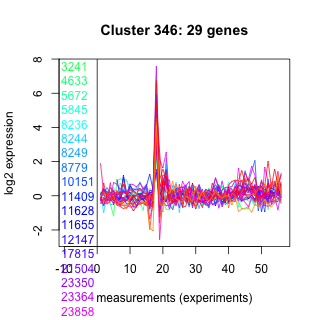
| Thaps_hclust_0346 |
 |
 |
0.00053 |
4.7 |
80 |
diel_light_vs_dark | 0.906000 | 0.033 |
| Thaps_hclust_0346 |
|
|
0.00053 |
4.7 |
80 |
lowFe_KTKB_Day3 | 0.082100 | -0.334 |
| Thaps_hclust_0346 |
|
|
0.00053 |
4.7 |
80 |
lowFe_KTKB_Day5 | 0.284000 | -0.182 |
| Thaps_hclust_0346 |
|
|
0.00053 |
4.7 |
80 |
BaP | 0.000370 | 1.22 |
| Thaps_hclust_0346 |
|
|
0.00053 |
4.7 |
80 |
exponential_vs_stationary_24highlight | 0.806000 | 0.0252 |
| Thaps_hclust_0346 |
|
|
0.00053 |
4.7 |
80 |
co2_elevated_stat_arrays | 0.922000 | -0.0294 |
| Thaps_hclust_0346 |
|
|
0.00053 |
4.7 |
80 |
lowtemp_TMEVA | 0.745000 | -0.0775 |
| Thaps_hclust_0346 |
|
|
0.00053 |
4.7 |
80 |
highpH_TMEVA | 0.854000 | -0.0348 |
| Thaps_hclust_0346 |
|
|
0.00053 |
4.7 |
80 |
co2_elevated_expo_arrays | 0.616000 | 0.107 |
| Thaps_hclust_0346 |
|
|
0.00053 |
4.7 |
80 |
lowFe_TMEVA | 0.933000 | -0.0359 |
| Thaps_hclust_0346 |
|
|
0.00053 |
4.7 |
80 |
exponential_vs_stationary_24light | 0.982000 | 0.00874 |
| Thaps_hclust_0346 |
|
|
0.00053 |
4.7 |
80 |
lowN_TMEVA | 0.944000 | -0.0276 |
| Thaps_hclust_0346 |
|
|
0.00053 |
4.7 |
80 |
diel_exponential_vs_stationary | 0.813000 | -0.045 |
| Thaps_hclust_0346 |
|
|
0.00053 |
4.7 |
80 |
lowSi_TMEVA | 1.000000 | -0.0296 |
| Thaps_hclust_0346 |
|
|
0.00053 |
4.7 |
80 |
highlight_arrays | 0.716000 | 0.0581 |
| Title | Cluster Plot | Dendrogram | e-value | e-value | e-value | Condition | Condition FDR | Condition Difference |
|---|---|---|---|---|---|---|---|---|
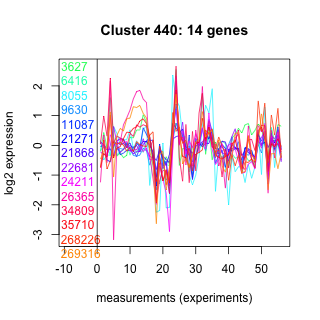
| Thaps_hclust_0440 |
 |
 |
0.68 |
4.6 |
250 |
co2_elevated_stat_arrays | 0.022700 | -0.562 |
| Thaps_hclust_0440 |
|
|
0.68 |
4.6 |
250 |
lowtemp_TMEVA | 0.377000 | -0.269 |
| Thaps_hclust_0440 |
|
|
0.68 |
4.6 |
250 |
highpH_TMEVA | 0.116000 | -0.285 |
| Thaps_hclust_0440 |
|
|
0.68 |
4.6 |
250 |
co2_elevated_expo_arrays | 0.922000 | 0.0504 |
| Thaps_hclust_0440 |
|
|
0.68 |
4.6 |
250 |
lowFe_TMEVA | 0.908000 | 0.051 |
| Thaps_hclust_0440 |
|
|
0.68 |
4.6 |
250 |
exponential_vs_stationary_24light | 0.074100 | 0.646 |
| Thaps_hclust_0440 |
|
|
0.68 |
4.6 |
250 |
lowN_TMEVA | 0.489000 | -0.274 |
| Thaps_hclust_0440 |
|
|
0.68 |
4.6 |
250 |
diel_exponential_vs_stationary | 0.010800 | 0.531 |
| Thaps_hclust_0440 |
|
|
0.68 |
4.6 |
250 |
lowSi_TMEVA | 0.317000 | 0.556 |
| Thaps_hclust_0440 |
|
|
0.68 |
4.6 |
250 |
highlight_arrays | 0.075500 | -0.33 |
| Thaps_hclust_0440 |
|
|
0.68 |
4.6 |
250 |
diel_light_vs_dark | 0.959000 | 0.0196 |
| Thaps_hclust_0440 |
|
|
0.68 |
4.6 |
250 |
lowFe_KTKB_Day3 | 0.595000 | -0.17 |
| Thaps_hclust_0440 |
|
|
0.68 |
4.6 |
250 |
lowFe_KTKB_Day5 | 0.188000 | -0.325 |
| Thaps_hclust_0440 |
|
|
0.68 |
4.6 |
250 |
BaP | 0.000370 | -0.92 |
| Thaps_hclust_0440 |
|
|
0.68 |
4.6 |
250 |
exponential_vs_stationary_24highlight | 0.533000 | 0.0868 |
| Title | Cluster Plot | Dendrogram | e-value | e-value | e-value | Condition | Condition FDR | Condition Difference |
|---|---|---|---|---|---|---|---|---|
| Thaps_hclust_0157 |
 |
 |
2 |
4.6 |
4.9 |
highlight_arrays | 0.819000 | -0.0582 |
| Thaps_hclust_0157 |
|
|
2 |
4.6 |
4.9 |
diel_light_vs_dark | 0.882000 | -0.0678 |
| Thaps_hclust_0157 |
|
|
2 |
4.6 |
4.9 |
lowFe_KTKB_Day3 | 0.022400 | -0.826 |
| Thaps_hclust_0157 |
|
|
2 |
4.6 |
4.9 |
lowFe_KTKB_Day5 | 0.056800 | -0.596 |
| Thaps_hclust_0157 |
|
|
2 |
4.6 |
4.9 |
BaP | 0.130000 | -0.48 |
| Thaps_hclust_0157 |
|
|
2 |
4.6 |
4.9 |
exponential_vs_stationary_24highlight | 0.633000 | 0.0815 |
| Thaps_hclust_0157 |
|
|
2 |
4.6 |
4.9 |
co2_elevated_stat_arrays | 0.405000 | -0.254 |
| Thaps_hclust_0157 |
|
|
2 |
4.6 |
4.9 |
lowtemp_TMEVA | 0.966000 | -0.0202 |
| Thaps_hclust_0157 |
|
|
2 |
4.6 |
4.9 |
highpH_TMEVA | 0.142000 | -0.331 |
| Thaps_hclust_0157 |
|
|
2 |
4.6 |
4.9 |
co2_elevated_expo_arrays | 0.580000 | 0.157 |
| Thaps_hclust_0157 |
|
|
2 |
4.6 |
4.9 |
lowFe_TMEVA | 0.033600 | -0.801 |
| Thaps_hclust_0157 |
|
|
2 |
4.6 |
4.9 |
exponential_vs_stationary_24light | 0.837000 | 0.113 |
| Thaps_hclust_0157 |
|
|
2 |
4.6 |
4.9 |
lowN_TMEVA | 0.699000 | 0.18 |
| Thaps_hclust_0157 |
|
|
2 |
4.6 |
4.9 |
diel_exponential_vs_stationary | 0.965000 | 0.017 |
| Thaps_hclust_0157 |
|
|
2 |
4.6 |
4.9 |
lowSi_TMEVA | 0.436000 | -0.54 |
| Title | Cluster Plot | Dendrogram | e-value | e-value | e-value | Condition | Condition FDR | Condition Difference |
|---|---|---|---|---|---|---|---|---|
| Thaps_hclust_0333 |
 |
 |
0.00062 |
4 |
17 |
exponential_vs_stationary_24highlight | 0.000926 | -0.306 |
| Thaps_hclust_0333 |
|
|
0.00062 |
4 |
17 |
co2_elevated_stat_arrays | 0.642000 | 0.12 |
| Thaps_hclust_0333 |
|
|
0.00062 |
4 |
17 |
lowtemp_TMEVA | 0.792000 | -0.0706 |
| Thaps_hclust_0333 |
|
|
0.00062 |
4 |
17 |
highpH_TMEVA | 0.112000 | -0.222 |
| Thaps_hclust_0333 |
|
|
0.00062 |
4 |
17 |
co2_elevated_expo_arrays | 0.600000 | 0.114 |
| Thaps_hclust_0333 |
|
|
0.00062 |
4 |
17 |
lowFe_TMEVA | 0.997000 | -0.00209 |
| Thaps_hclust_0333 |
|
|
0.00062 |
4 |
17 |
exponential_vs_stationary_24light | 0.013500 | -0.667 |
| Thaps_hclust_0333 |
|
|
0.00062 |
4 |
17 |
lowN_TMEVA | 0.351000 | 0.294 |
| Thaps_hclust_0333 |
|
|
0.00062 |
4 |
17 |
diel_exponential_vs_stationary | 0.010000 | -0.376 |
| Thaps_hclust_0333 |
|
|
0.00062 |
4 |
17 |
lowSi_TMEVA | 0.776000 | 0.257 |
| Thaps_hclust_0333 |
|
|
0.00062 |
4 |
17 |
highlight_arrays | 0.377000 | 0.131 |
| Thaps_hclust_0333 |
|
|
0.00062 |
4 |
17 |
diel_light_vs_dark | 0.012500 | -0.437 |
| Thaps_hclust_0333 |
|
|
0.00062 |
4 |
17 |
lowFe_KTKB_Day3 | 0.139000 | 0.304 |
| Thaps_hclust_0333 |
|
|
0.00062 |
4 |
17 |
lowFe_KTKB_Day5 | 0.095200 | 0.294 |
| Thaps_hclust_0333 |
|
|
0.00062 |
4 |
17 |
BaP | 0.044400 | -0.37 |
| Title | Cluster Plot | Dendrogram | e-value | e-value | e-value | Condition | Condition FDR | Condition Difference |
|---|---|---|---|---|---|---|---|---|
| Thaps_hclust_0106 |
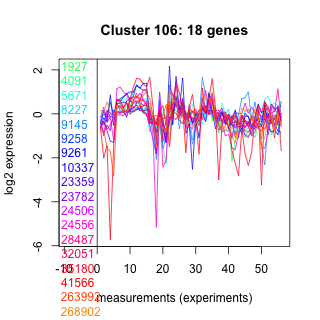 |
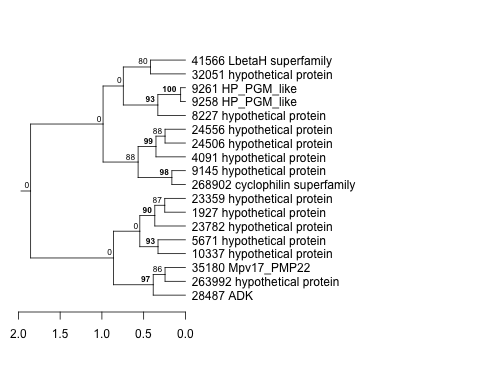 |
0.48 |
3.7 |
8.9 |
lowFe_KTKB_Day5 | 0.134000 | -0.313 |
| Thaps_hclust_0106 |
|
|
0.48 |
3.7 |
8.9 |
BaP | 0.001620 | -0.688 |
| Thaps_hclust_0106 |
|
|
0.48 |
3.7 |
8.9 |
exponential_vs_stationary_24highlight | 0.143000 | -0.165 |
| Thaps_hclust_0106 |
|
|
0.48 |
3.7 |
8.9 |
co2_elevated_stat_arrays | 0.370000 | 0.222 |
| Thaps_hclust_0106 |
|
|
0.48 |
3.7 |
8.9 |
lowtemp_TMEVA | 0.016800 | -0.664 |
| Thaps_hclust_0106 |
|
|
0.48 |
3.7 |
8.9 |
highpH_TMEVA | 0.010500 | -0.445 |
| Thaps_hclust_0106 |
|
|
0.48 |
3.7 |
8.9 |
co2_elevated_expo_arrays | 0.943000 | -0.0372 |
| Thaps_hclust_0106 |
|
|
0.48 |
3.7 |
8.9 |
lowFe_TMEVA | 0.097300 | -0.454 |
| Thaps_hclust_0106 |
|
|
0.48 |
3.7 |
8.9 |
exponential_vs_stationary_24light | 0.463000 | 0.263 |
| Thaps_hclust_0106 |
|
|
0.48 |
3.7 |
8.9 |
lowN_TMEVA | 0.212000 | -0.434 |
| Thaps_hclust_0106 |
|
|
0.48 |
3.7 |
8.9 |
diel_exponential_vs_stationary | 0.002530 | 0.568 |
| Thaps_hclust_0106 |
|
|
0.48 |
3.7 |
8.9 |
lowSi_TMEVA | 0.090800 | -0.73 |
| Thaps_hclust_0106 |
|
|
0.48 |
3.7 |
8.9 |
highlight_arrays | 0.125000 | -0.255 |
| Thaps_hclust_0106 |
|
|
0.48 |
3.7 |
8.9 |
diel_light_vs_dark | 0.298000 | -0.238 |
| Thaps_hclust_0106 |
|
|
0.48 |
3.7 |
8.9 |
lowFe_KTKB_Day3 | 0.910000 | 0.04 |
| Title | Cluster Plot | Dendrogram | e-value | e-value | e-value | Condition | Condition FDR | Condition Difference |
|---|---|---|---|---|---|---|---|---|
| Thaps_hclust_0191 |
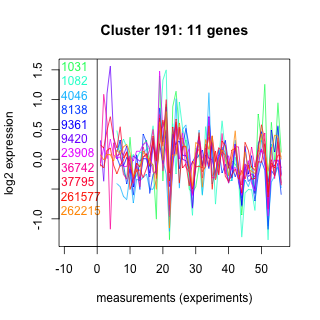 |
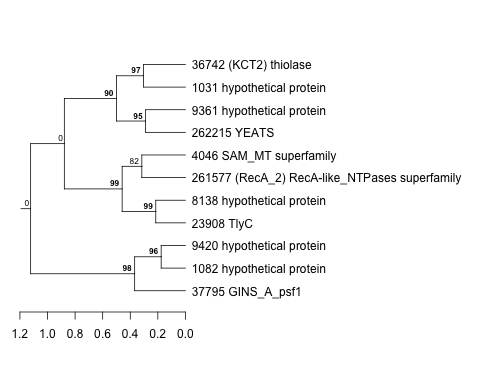 |
1.5 |
3.5 |
44 |
lowFe_KTKB_Day3 | 0.744000 | -0.122 |
| Thaps_hclust_0191 |
|
|
1.5 |
3.5 |
44 |
lowFe_KTKB_Day5 | 0.715000 | 0.105 |
| Thaps_hclust_0191 |
|
|
1.5 |
3.5 |
44 |
BaP | 0.264000 | 0.333 |
| Thaps_hclust_0191 |
|
|
1.5 |
3.5 |
44 |
exponential_vs_stationary_24highlight | 0.387000 | 0.129 |
| Thaps_hclust_0191 |
|
|
1.5 |
3.5 |
44 |
co2_elevated_stat_arrays | 0.044700 | -0.542 |
| Thaps_hclust_0191 |
|
|
1.5 |
3.5 |
44 |
lowtemp_TMEVA | 0.654000 | 0.158 |
| Thaps_hclust_0191 |
|
|
1.5 |
3.5 |
44 |
highpH_TMEVA | 0.807000 | 0.0611 |
| Thaps_hclust_0191 |
|
|
1.5 |
3.5 |
44 |
co2_elevated_expo_arrays | 0.934000 | 0.0449 |
| Thaps_hclust_0191 |
|
|
1.5 |
3.5 |
44 |
lowFe_TMEVA | 0.693000 | 0.156 |
| Thaps_hclust_0191 |
|
|
1.5 |
3.5 |
44 |
exponential_vs_stationary_24light | 0.348000 | 0.389 |
| Thaps_hclust_0191 |
|
|
1.5 |
3.5 |
44 |
lowN_TMEVA | 0.332000 | 0.409 |
| Thaps_hclust_0191 |
|
|
1.5 |
3.5 |
44 |
diel_exponential_vs_stationary | 0.783000 | 0.0779 |
| Thaps_hclust_0191 |
|
|
1.5 |
3.5 |
44 |
lowSi_TMEVA | 0.765000 | 0.284 |
| Thaps_hclust_0191 |
|
|
1.5 |
3.5 |
44 |
highlight_arrays | 0.345000 | -0.206 |
| Thaps_hclust_0191 |
|
|
1.5 |
3.5 |
44 |
diel_light_vs_dark | 0.787000 | 0.101 |
| Title | Cluster Plot | Dendrogram | e-value | e-value | e-value | Condition | Condition FDR | Condition Difference |
|---|---|---|---|---|---|---|---|---|
| Thaps_hclust_0236 |
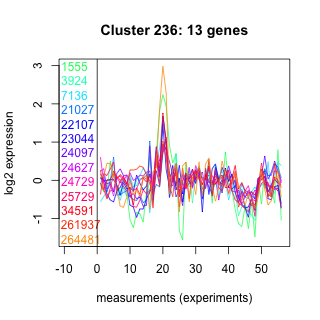 |
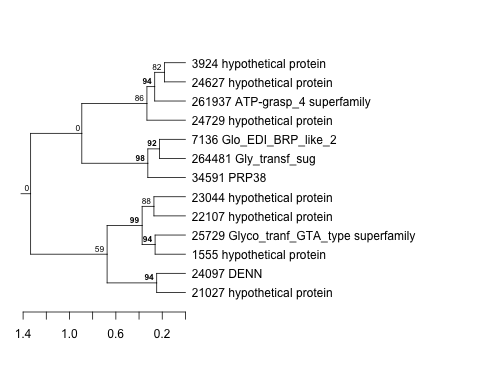 |
0.0078 |
3.3 |
1.1 |
lowtemp_TMEVA | 0.929000 | 0.034 |
| Thaps_hclust_0236 |
|
|
0.0078 |
3.3 |
1.1 |
highpH_TMEVA | 0.943000 | 0.0237 |
| Title | Cluster Plot | Dendrogram | e-value | e-value | e-value | Condition | Condition FDR | Condition Difference |
|---|---|---|---|---|---|---|---|---|
| Thaps_hclust_0376 |
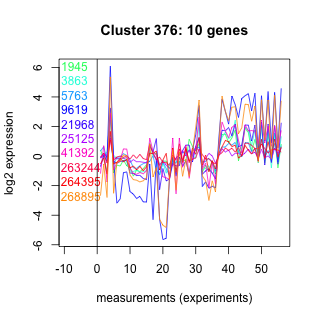 |
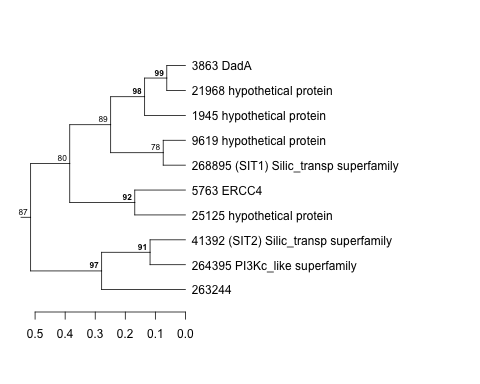 |
0.42 |
3.3 |
2.4 |
lowN_TMEVA | 0.093300 | -0.756 |
| Thaps_hclust_0376 |
|
|
0.42 |
3.3 |
2.4 |
diel_exponential_vs_stationary | 0.000602 | -1.52 |
| Thaps_hclust_0376 |
|
|
0.42 |
3.3 |
2.4 |
lowSi_TMEVA | 0.001350 | 2.82 |