Hierarchical Clusters
Displaying 401 - 500 of 7500
| Title | Cluster Plot | Dendrogram | e-value | e-value | e-value | Condition | Condition FDR | Condition Difference |
|---|---|---|---|---|---|---|---|---|
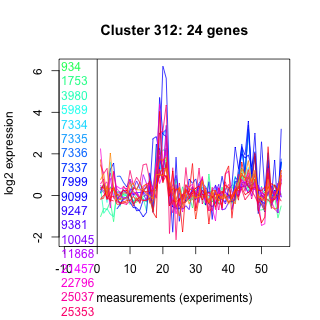
| Thaps_hclust_0312 |
 |
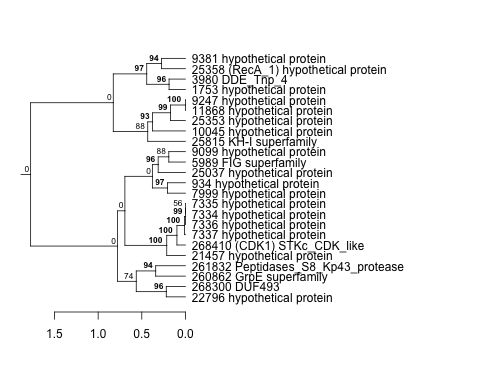 |
1.6e-19 |
9.9e-16 |
0.000000000033 |
exponential_vs_stationary_24light | 0.019000 | -0.641 |
| Thaps_hclust_0312 |
|
|
1.6e-19 |
9.9e-16 |
0.000000000033 |
lowN_TMEVA | 0.861000 | 0.0571 |
| Thaps_hclust_0312 |
|
|
1.6e-19 |
9.9e-16 |
0.000000000033 |
diel_exponential_vs_stationary | 0.441000 | -0.139 |
| Thaps_hclust_0312 |
|
|
1.6e-19 |
9.9e-16 |
0.000000000033 |
lowSi_TMEVA | 0.599000 | 0.334 |
| Thaps_hclust_0312 |
|
|
1.6e-19 |
9.9e-16 |
0.000000000033 |
highlight_arrays | 0.000442 | 0.559 |
| Title | Cluster Plot | Dendrogram | e-value | e-value | e-value | Condition | Condition FDR | Condition Difference |
|---|---|---|---|---|---|---|---|---|
| Thaps_hclust_0255 |
 |
 |
1.4e-28 |
0.0000000000000024 |
0.000000029 |
lowN_TMEVA | 1.000000 | |
| Thaps_hclust_0255 |
|
|
1.4e-28 |
0.0000000000000024 |
0.000000029 |
diel_exponential_vs_stationary | 0.010200 | 0.533 |
| Thaps_hclust_0255 |
|
|
1.4e-28 |
0.0000000000000024 |
0.000000029 |
lowSi_TMEVA | 1.000000 | |
| Thaps_hclust_0255 |
|
|
1.4e-28 |
0.0000000000000024 |
0.000000029 |
highlight_arrays | 0.000442 | -1.16 |
| Thaps_hclust_0255 |
|
|
1.4e-28 |
0.0000000000000024 |
0.000000029 |
diel_light_vs_dark | 0.000485 | -0.853 |
| Thaps_hclust_0255 |
|
|
1.4e-28 |
0.0000000000000024 |
0.000000029 |
lowFe_KTKB_Day3 | 1.000000 | |
| Thaps_hclust_0255 |
|
|
1.4e-28 |
0.0000000000000024 |
0.000000029 |
lowFe_KTKB_Day5 | 1.000000 | |
| Thaps_hclust_0255 |
|
|
1.4e-28 |
0.0000000000000024 |
0.000000029 |
BaP | 1.000000 | |
| Thaps_hclust_0255 |
|
|
1.4e-28 |
0.0000000000000024 |
0.000000029 |
exponential_vs_stationary_24highlight | 0.002870 | -0.36 |
| Thaps_hclust_0255 |
|
|
1.4e-28 |
0.0000000000000024 |
0.000000029 |
co2_elevated_stat_arrays | 0.006310 | 0.6 |
| Thaps_hclust_0255 |
|
|
1.4e-28 |
0.0000000000000024 |
0.000000029 |
lowtemp_TMEVA | 1.000000 | |
| Thaps_hclust_0255 |
|
|
1.4e-28 |
0.0000000000000024 |
0.000000029 |
highpH_TMEVA | 1.000000 | |
| Thaps_hclust_0255 |
|
|
1.4e-28 |
0.0000000000000024 |
0.000000029 |
co2_elevated_expo_arrays | 0.903000 | 0.0569 |
| Thaps_hclust_0255 |
|
|
1.4e-28 |
0.0000000000000024 |
0.000000029 |
lowFe_TMEVA | 1.000000 | |
| Thaps_hclust_0255 |
|
|
1.4e-28 |
0.0000000000000024 |
0.000000029 |
exponential_vs_stationary_24light | 0.576000 | 0.224 |
| Title | Cluster Plot | Dendrogram | e-value | e-value | e-value | Condition | Condition FDR | Condition Difference |
|---|---|---|---|---|---|---|---|---|
| Thaps_hclust_0208 |
 |
|
1.2e-20 |
0.0000000000000057 |
0.0000000099 |
diel_light_vs_dark | 0.000485 | 0.714 |
| Thaps_hclust_0208 |
|
|
1.2e-20 |
0.0000000000000057 |
0.0000000099 |
lowFe_KTKB_Day3 | 0.968000 | -0.00748 |
| Thaps_hclust_0208 |
|
|
1.2e-20 |
0.0000000000000057 |
0.0000000099 |
lowFe_KTKB_Day5 | 0.561000 | -0.0717 |
| Thaps_hclust_0208 |
|
|
1.2e-20 |
0.0000000000000057 |
0.0000000099 |
BaP | 0.000370 | 0.466 |
| Thaps_hclust_0208 |
|
|
1.2e-20 |
0.0000000000000057 |
0.0000000099 |
exponential_vs_stationary_24highlight | 0.000526 | 0.404 |
| Thaps_hclust_0208 |
|
|
1.2e-20 |
0.0000000000000057 |
0.0000000099 |
co2_elevated_stat_arrays | 0.000658 | -0.474 |
| Thaps_hclust_0208 |
|
|
1.2e-20 |
0.0000000000000057 |
0.0000000099 |
lowtemp_TMEVA | 0.800000 | 0.0444 |
| Thaps_hclust_0208 |
|
|
1.2e-20 |
0.0000000000000057 |
0.0000000099 |
highpH_TMEVA | 0.329000 | 0.102 |
| Thaps_hclust_0208 |
|
|
1.2e-20 |
0.0000000000000057 |
0.0000000099 |
co2_elevated_expo_arrays | 0.985000 | -0.014 |
| Thaps_hclust_0208 |
|
|
1.2e-20 |
0.0000000000000057 |
0.0000000099 |
lowFe_TMEVA | 0.996000 | -0.00415 |
| Thaps_hclust_0208 |
|
|
1.2e-20 |
0.0000000000000057 |
0.0000000099 |
exponential_vs_stationary_24light | 0.000581 | 0.911 |
| Thaps_hclust_0208 |
|
|
1.2e-20 |
0.0000000000000057 |
0.0000000099 |
lowN_TMEVA | 0.001190 | -0.59 |
| Thaps_hclust_0208 |
|
|
1.2e-20 |
0.0000000000000057 |
0.0000000099 |
diel_exponential_vs_stationary | 0.099000 | 0.161 |
| Thaps_hclust_0208 |
|
|
1.2e-20 |
0.0000000000000057 |
0.0000000099 |
lowSi_TMEVA | 0.445000 | -0.334 |
| Thaps_hclust_0208 |
|
|
1.2e-20 |
0.0000000000000057 |
0.0000000099 |
highlight_arrays | 0.002290 | -0.269 |
| Title | Cluster Plot | Dendrogram | e-value | e-value | e-value | Condition | Condition FDR | Condition Difference |
|---|---|---|---|---|---|---|---|---|
| Thaps_hclust_0099 |
 |
 |
0.0000000000000032 |
0.000000000000013 |
0.000000000000025 |
exponential_vs_stationary_24light | 0.055600 | 1.17 |
| Thaps_hclust_0099 |
|
|
0.0000000000000032 |
0.000000000000013 |
0.000000000000025 |
lowN_TMEVA | 0.027400 | -1.48 |
| Thaps_hclust_0099 |
|
|
0.0000000000000032 |
0.000000000000013 |
0.000000000000025 |
diel_exponential_vs_stationary | 0.837000 | 0.0789 |
| Thaps_hclust_0099 |
|
|
0.0000000000000032 |
0.000000000000013 |
0.000000000000025 |
lowSi_TMEVA | 0.021200 | -1.72 |
| Thaps_hclust_0099 |
|
|
0.0000000000000032 |
0.000000000000013 |
0.000000000000025 |
highlight_arrays | 0.036900 | 0.656 |
| Thaps_hclust_0099 |
|
|
0.0000000000000032 |
0.000000000000013 |
0.000000000000025 |
diel_light_vs_dark | 0.152000 | -0.59 |
| Thaps_hclust_0099 |
|
|
0.0000000000000032 |
0.000000000000013 |
0.000000000000025 |
lowFe_KTKB_Day3 | 0.887000 | 0.0802 |
| Thaps_hclust_0099 |
|
|
0.0000000000000032 |
0.000000000000013 |
0.000000000000025 |
lowFe_KTKB_Day5 | 0.284000 | -0.427 |
| Thaps_hclust_0099 |
|
|
0.0000000000000032 |
0.000000000000013 |
0.000000000000025 |
BaP | 0.183000 | -0.581 |
| Thaps_hclust_0099 |
|
|
0.0000000000000032 |
0.000000000000013 |
0.000000000000025 |
exponential_vs_stationary_24highlight | 0.000526 | 0.919 |
| Thaps_hclust_0099 |
|
|
0.0000000000000032 |
0.000000000000013 |
0.000000000000025 |
co2_elevated_stat_arrays | 0.070300 | 0.686 |
| Thaps_hclust_0099 |
|
|
0.0000000000000032 |
0.000000000000013 |
0.000000000000025 |
lowtemp_TMEVA | 0.020700 | -1.41 |
| Thaps_hclust_0099 |
|
|
0.0000000000000032 |
0.000000000000013 |
0.000000000000025 |
highpH_TMEVA | 0.053300 | 0.615 |
| Thaps_hclust_0099 |
|
|
0.0000000000000032 |
0.000000000000013 |
0.000000000000025 |
co2_elevated_expo_arrays | 1.000000 | -0.00337 |
| Thaps_hclust_0099 |
|
|
0.0000000000000032 |
0.000000000000013 |
0.000000000000025 |
lowFe_TMEVA | 0.216000 | -0.629 |
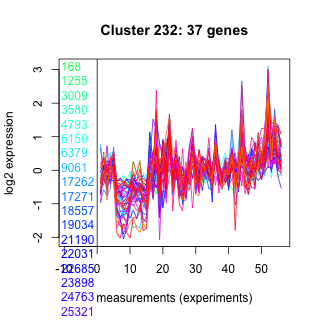
| Title | Cluster Plot | Dendrogram | e-value | e-value | e-value | Condition | Condition FDR | Condition Difference |
|---|---|---|---|---|---|---|---|---|
| Thaps_hclust_0232 |
 |
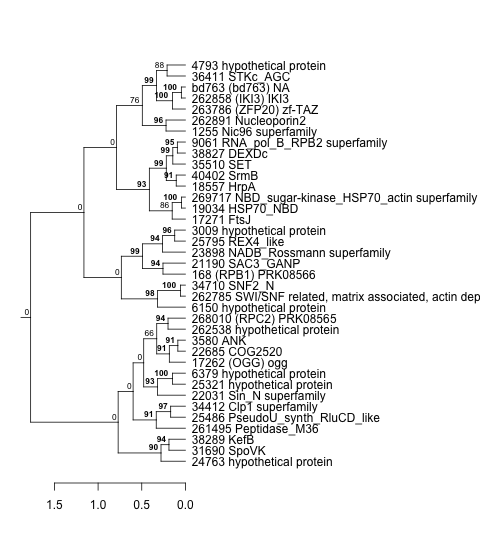 |
9.2e-16 |
0.000000000000019 |
0.35 |
lowtemp_TMEVA | 0.575000 | 0.116 |
| Thaps_hclust_0232 |
|
|
9.2e-16 |
0.000000000000019 |
0.35 |
highpH_TMEVA | 0.005910 | -0.315 |
| Thaps_hclust_0232 |
|
|
9.2e-16 |
0.000000000000019 |
0.35 |
co2_elevated_expo_arrays | 0.926000 | -0.0453 |
| Thaps_hclust_0232 |
|
|
9.2e-16 |
0.000000000000019 |
0.35 |
lowFe_TMEVA | 0.940000 | -0.0331 |
| Thaps_hclust_0232 |
|
|
9.2e-16 |
0.000000000000019 |
0.35 |
exponential_vs_stationary_24light | 0.249000 | -0.292 |
| Thaps_hclust_0232 |
|
|
9.2e-16 |
0.000000000000019 |
0.35 |
lowN_TMEVA | 0.725000 | -0.128 |
| Thaps_hclust_0232 |
|
|
9.2e-16 |
0.000000000000019 |
0.35 |
diel_exponential_vs_stationary | 0.378000 | 0.128 |
| Thaps_hclust_0232 |
|
|
9.2e-16 |
0.000000000000019 |
0.35 |
lowSi_TMEVA | 1.000000 | 0.0497 |
| Thaps_hclust_0232 |
|
|
9.2e-16 |
0.000000000000019 |
0.35 |
highlight_arrays | 0.000442 | -0.468 |
| Thaps_hclust_0232 |
|
|
9.2e-16 |
0.000000000000019 |
0.35 |
diel_light_vs_dark | 0.240000 | -0.186 |
| Thaps_hclust_0232 |
|
|
9.2e-16 |
0.000000000000019 |
0.35 |
lowFe_KTKB_Day3 | 0.779000 | 0.0616 |
| Thaps_hclust_0232 |
|
|
9.2e-16 |
0.000000000000019 |
0.35 |
lowFe_KTKB_Day5 | 0.849000 | -0.033 |
| Thaps_hclust_0232 |
|
|
9.2e-16 |
0.000000000000019 |
0.35 |
BaP | 0.699000 | 0.0692 |
| Thaps_hclust_0232 |
|
|
9.2e-16 |
0.000000000000019 |
0.35 |
exponential_vs_stationary_24highlight | 0.587000 | -0.0468 |
| Thaps_hclust_0232 |
|
|
9.2e-16 |
0.000000000000019 |
0.35 |
co2_elevated_stat_arrays | 0.002130 | 0.46 |
| Title | Cluster Plot | Dendrogram | e-value | e-value | e-value | Condition | Condition FDR | Condition Difference |
|---|---|---|---|---|---|---|---|---|
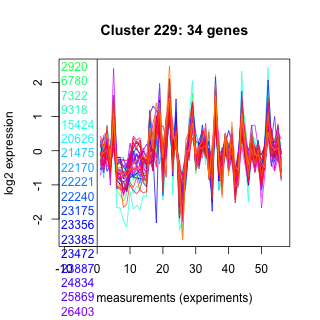
| Thaps_hclust_0229 |
 |
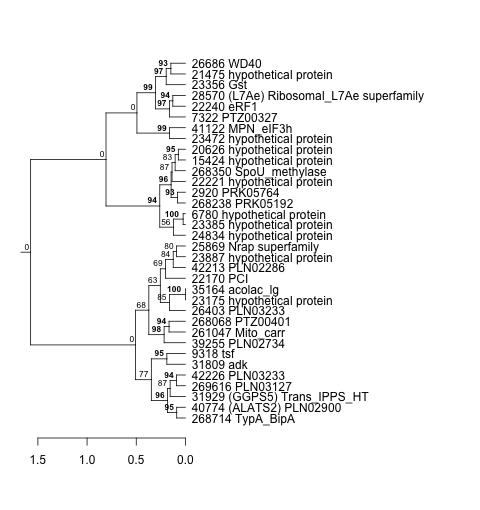 |
9.9e-18 |
0.000000000000034 |
0.0000002 |
BaP | 0.029500 | 0.342 |
| Thaps_hclust_0229 |
|
|
9.9e-18 |
0.000000000000034 |
0.0000002 |
exponential_vs_stationary_24highlight | 0.024400 | 0.176 |
| Thaps_hclust_0229 |
|
|
9.9e-18 |
0.000000000000034 |
0.0000002 |
co2_elevated_stat_arrays | 0.000658 | 0.914 |
| Thaps_hclust_0229 |
|
|
9.9e-18 |
0.000000000000034 |
0.0000002 |
lowtemp_TMEVA | 0.000735 | 0.823 |
| Thaps_hclust_0229 |
|
|
9.9e-18 |
0.000000000000034 |
0.0000002 |
highpH_TMEVA | 0.358000 | -0.122 |
| Thaps_hclust_0229 |
|
|
9.9e-18 |
0.000000000000034 |
0.0000002 |
co2_elevated_expo_arrays | 0.323000 | -0.144 |
| Thaps_hclust_0229 |
|
|
9.9e-18 |
0.000000000000034 |
0.0000002 |
lowFe_TMEVA | 0.651000 | -0.133 |
| Thaps_hclust_0229 |
|
|
9.9e-18 |
0.000000000000034 |
0.0000002 |
exponential_vs_stationary_24light | 0.900000 | 0.0438 |
| Thaps_hclust_0229 |
|
|
9.9e-18 |
0.000000000000034 |
0.0000002 |
lowN_TMEVA | 0.470000 | 0.229 |
| Thaps_hclust_0229 |
|
|
9.9e-18 |
0.000000000000034 |
0.0000002 |
diel_exponential_vs_stationary | 0.693000 | 0.0659 |
| Thaps_hclust_0229 |
|
|
9.9e-18 |
0.000000000000034 |
0.0000002 |
lowSi_TMEVA | 0.500000 | -0.364 |
| Thaps_hclust_0229 |
|
|
9.9e-18 |
0.000000000000034 |
0.0000002 |
highlight_arrays | 0.497000 | -0.0937 |
| Thaps_hclust_0229 |
|
|
9.9e-18 |
0.000000000000034 |
0.0000002 |
diel_light_vs_dark | 0.075900 | -0.27 |
| Thaps_hclust_0229 |
|
|
9.9e-18 |
0.000000000000034 |
0.0000002 |
lowFe_KTKB_Day3 | 0.046800 | 0.345 |
| Thaps_hclust_0229 |
|
|
9.9e-18 |
0.000000000000034 |
0.0000002 |
lowFe_KTKB_Day5 | 0.650000 | 0.0779 |
| Title | Cluster Plot | Dendrogram | e-value | e-value | e-value | Condition | Condition FDR | Condition Difference |
|---|---|---|---|---|---|---|---|---|
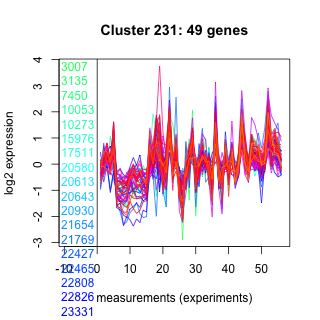
| Thaps_hclust_0231 |
 |
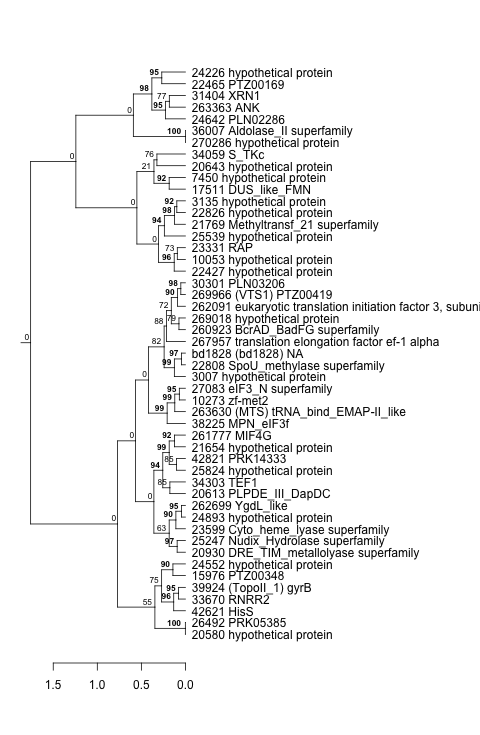 |
9.5e-23 |
0.000000000000034 |
0.00000039 |
co2_elevated_stat_arrays | 0.000658 | 0.774 |
| Thaps_hclust_0231 |
|
|
9.5e-23 |
0.000000000000034 |
0.00000039 |
lowtemp_TMEVA | 0.000735 | 0.588 |
| Thaps_hclust_0231 |
|
|
9.5e-23 |
0.000000000000034 |
0.00000039 |
highpH_TMEVA | 0.027300 | -0.234 |
| Thaps_hclust_0231 |
|
|
9.5e-23 |
0.000000000000034 |
0.00000039 |
co2_elevated_expo_arrays | 0.487000 | -0.113 |
| Thaps_hclust_0231 |
|
|
9.5e-23 |
0.000000000000034 |
0.00000039 |
lowFe_TMEVA | 0.823000 | 0.0825 |
| Thaps_hclust_0231 |
|
|
9.5e-23 |
0.000000000000034 |
0.00000039 |
exponential_vs_stationary_24light | 0.576000 | -0.153 |
| Thaps_hclust_0231 |
|
|
9.5e-23 |
0.000000000000034 |
0.00000039 |
lowN_TMEVA | 0.607000 | 0.165 |
| Thaps_hclust_0231 |
|
|
9.5e-23 |
0.000000000000034 |
0.00000039 |
diel_exponential_vs_stationary | 0.196000 | 0.149 |
| Thaps_hclust_0231 |
|
|
9.5e-23 |
0.000000000000034 |
0.00000039 |
lowSi_TMEVA | 1.000000 | -0.0141 |
| Thaps_hclust_0231 |
|
|
9.5e-23 |
0.000000000000034 |
0.00000039 |
highlight_arrays | 0.110000 | -0.169 |
| Thaps_hclust_0231 |
|
|
9.5e-23 |
0.000000000000034 |
0.00000039 |
diel_light_vs_dark | 0.052700 | -0.244 |
| Thaps_hclust_0231 |
|
|
9.5e-23 |
0.000000000000034 |
0.00000039 |
lowFe_KTKB_Day3 | 0.062700 | 0.272 |
| Thaps_hclust_0231 |
|
|
9.5e-23 |
0.000000000000034 |
0.00000039 |
lowFe_KTKB_Day5 | 0.345000 | 0.127 |
| Thaps_hclust_0231 |
|
|
9.5e-23 |
0.000000000000034 |
0.00000039 |
BaP | 0.342000 | 0.135 |
| Thaps_hclust_0231 |
|
|
9.5e-23 |
0.000000000000034 |
0.00000039 |
exponential_vs_stationary_24highlight | 0.476000 | 0.052 |
| Title | Cluster Plot | Dendrogram | e-value | e-value | e-value | Condition | Condition FDR | Condition Difference |
|---|---|---|---|---|---|---|---|---|
| Thaps_hclust_0039 |
 |
 |
2.2e-16 |
0.000000000000049 |
0.00083 |
diel_exponential_vs_stationary | 0.900000 | -0.0196 |
| Thaps_hclust_0039 |
|
|
2.2e-16 |
0.000000000000049 |
0.00083 |
lowSi_TMEVA | 0.074100 | -0.531 |
| Thaps_hclust_0039 |
|
|
2.2e-16 |
0.000000000000049 |
0.00083 |
highlight_arrays | 0.017500 | -0.246 |
| Thaps_hclust_0039 |
|
|
2.2e-16 |
0.000000000000049 |
0.00083 |
diel_light_vs_dark | 0.000485 | -1.91 |
| Thaps_hclust_0039 |
|
|
2.2e-16 |
0.000000000000049 |
0.00083 |
lowFe_KTKB_Day3 | 0.974000 | 0.00625 |