Hierarchical Clusters
Displaying 6001 - 6100 of 7500
| Title | Cluster Plot | Dendrogram | e-value | e-value | e-value | Condition | Condition FDR | Condition Difference |
|---|---|---|---|---|---|---|---|---|
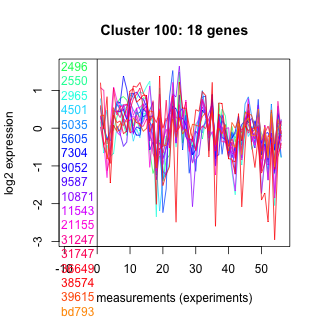
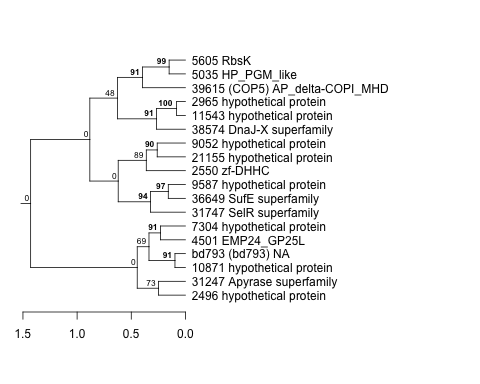
| Thaps_hclust_0100 |
 |
 |
0.00000073 |
0.000076 |
2.6 |
lowSi_TMEVA | 0.332000 | -0.502 |
| Thaps_hclust_0100 |
|
|
0.00000073 |
0.000076 |
2.6 |
highlight_arrays | 0.160000 | 0.236 |
| Thaps_hclust_0100 |
|
|
0.00000073 |
0.000076 |
2.6 |
diel_light_vs_dark | 0.029500 | 0.447 |
| Thaps_hclust_0100 |
|
|
0.00000073 |
0.000076 |
2.6 |
lowFe_KTKB_Day3 | 0.746000 | 0.101 |
| Thaps_hclust_0100 |
|
|
0.00000073 |
0.000076 |
2.6 |
lowFe_KTKB_Day5 | 0.957000 | 0.0151 |
| Thaps_hclust_0100 |
|
|
0.00000073 |
0.000076 |
2.6 |
BaP | 0.004070 | -0.613 |
| Thaps_hclust_0100 |
|
|
0.00000073 |
0.000076 |
2.6 |
exponential_vs_stationary_24highlight | 0.079900 | 0.196 |
| Thaps_hclust_0100 |
|
|
0.00000073 |
0.000076 |
2.6 |
co2_elevated_stat_arrays | 0.512000 | 0.168 |
| Thaps_hclust_0100 |
|
|
0.00000073 |
0.000076 |
2.6 |
lowtemp_TMEVA | 0.206000 | 0.343 |
| Thaps_hclust_0100 |
|
|
0.00000073 |
0.000076 |
2.6 |
highpH_TMEVA | 0.003570 | 0.515 |
| Thaps_hclust_0100 |
|
|
0.00000073 |
0.000076 |
2.6 |
co2_elevated_expo_arrays | 0.725000 | -0.0996 |
| Thaps_hclust_0100 |
|
|
0.00000073 |
0.000076 |
2.6 |
lowFe_TMEVA | 0.899000 | -0.052 |
| Thaps_hclust_0100 |
|
|
0.00000073 |
0.000076 |
2.6 |
exponential_vs_stationary_24light | 0.034600 | 0.695 |
| Thaps_hclust_0100 |
|
|
0.00000073 |
0.000076 |
2.6 |
lowN_TMEVA | 0.261000 | -0.394 |
| Thaps_hclust_0100 |
|
|
0.00000073 |
0.000076 |
2.6 |
diel_exponential_vs_stationary | 0.073200 | 0.333 |
| Title | Cluster Plot | Dendrogram | e-value | e-value | e-value | Condition | Condition FDR | Condition Difference |
|---|---|---|---|---|---|---|---|---|
| Thaps_hclust_0099 |
 |
 |
0.0000000000000032 |
0.000000000000013 |
0.000000000000025 |
diel_exponential_vs_stationary | 0.837000 | 0.0789 |
| Thaps_hclust_0099 |
|
|
0.0000000000000032 |
0.000000000000013 |
0.000000000000025 |
lowSi_TMEVA | 0.021200 | -1.72 |
| Thaps_hclust_0099 |
|
|
0.0000000000000032 |
0.000000000000013 |
0.000000000000025 |
highlight_arrays | 0.036900 | 0.656 |
| Thaps_hclust_0099 |
|
|
0.0000000000000032 |
0.000000000000013 |
0.000000000000025 |
diel_light_vs_dark | 0.152000 | -0.59 |
| Thaps_hclust_0099 |
|
|
0.0000000000000032 |
0.000000000000013 |
0.000000000000025 |
lowFe_KTKB_Day3 | 0.887000 | 0.0802 |
| Thaps_hclust_0099 |
|
|
0.0000000000000032 |
0.000000000000013 |
0.000000000000025 |
lowFe_KTKB_Day5 | 0.284000 | -0.427 |
| Thaps_hclust_0099 |
|
|
0.0000000000000032 |
0.000000000000013 |
0.000000000000025 |
BaP | 0.183000 | -0.581 |
| Thaps_hclust_0099 |
|
|
0.0000000000000032 |
0.000000000000013 |
0.000000000000025 |
exponential_vs_stationary_24highlight | 0.000526 | 0.919 |
| Thaps_hclust_0099 |
|
|
0.0000000000000032 |
0.000000000000013 |
0.000000000000025 |
co2_elevated_stat_arrays | 0.070300 | 0.686 |
| Thaps_hclust_0099 |
|
|
0.0000000000000032 |
0.000000000000013 |
0.000000000000025 |
lowtemp_TMEVA | 0.020700 | -1.41 |
| Thaps_hclust_0099 |
|
|
0.0000000000000032 |
0.000000000000013 |
0.000000000000025 |
highpH_TMEVA | 0.053300 | 0.615 |
| Thaps_hclust_0099 |
|
|
0.0000000000000032 |
0.000000000000013 |
0.000000000000025 |
co2_elevated_expo_arrays | 1.000000 | -0.00337 |
| Thaps_hclust_0099 |
|
|
0.0000000000000032 |
0.000000000000013 |
0.000000000000025 |
lowFe_TMEVA | 0.216000 | -0.629 |
| Thaps_hclust_0099 |
|
|
0.0000000000000032 |
0.000000000000013 |
0.000000000000025 |
exponential_vs_stationary_24light | 0.055600 | 1.17 |
| Thaps_hclust_0099 |
|
|
0.0000000000000032 |
0.000000000000013 |
0.000000000000025 |
lowN_TMEVA | 0.027400 | -1.48 |
| Title | Cluster Plot | Dendrogram | e-value | e-value | e-value | Condition | Condition FDR | Condition Difference |
|---|---|---|---|---|---|---|---|---|
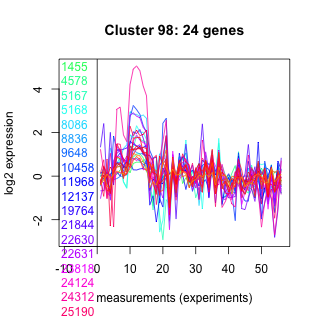
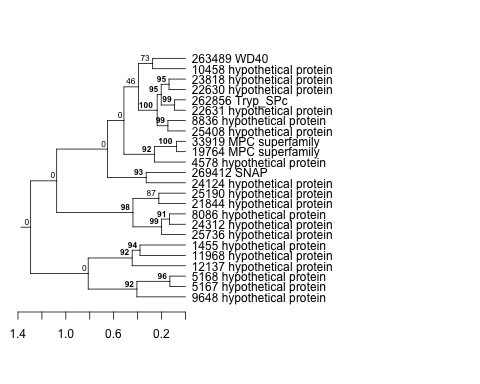
| Thaps_hclust_0098 |
 |
 |
0.0000000015 |
0.17 |
19 |
lowN_TMEVA | 0.566000 | -0.205 |
| Thaps_hclust_0098 |
|
|
0.0000000015 |
0.17 |
19 |
diel_exponential_vs_stationary | 0.567000 | 0.107 |
| Thaps_hclust_0098 |
|
|
0.0000000015 |
0.17 |
19 |
lowSi_TMEVA | 0.965000 | -0.154 |
| Thaps_hclust_0098 |
|
|
0.0000000015 |
0.17 |
19 |
highlight_arrays | 0.988000 | -0.00199 |
| Thaps_hclust_0098 |
|
|
0.0000000015 |
0.17 |
19 |
diel_light_vs_dark | 0.000926 | 0.577 |
| Thaps_hclust_0098 |
|
|
0.0000000015 |
0.17 |
19 |
lowFe_KTKB_Day3 | 0.954000 | 0.0159 |
| Thaps_hclust_0098 |
|
|
0.0000000015 |
0.17 |
19 |
BaP | 0.930000 | 0.0244 |
| Thaps_hclust_0098 |
|
|
0.0000000015 |
0.17 |
19 |
lowFe_KTKB_Day5 | 0.915000 | 0.0224 |
| Thaps_hclust_0098 |
|
|
0.0000000015 |
0.17 |
19 |
exponential_vs_stationary_24highlight | 0.223000 | 0.123 |
| Thaps_hclust_0098 |
|
|
0.0000000015 |
0.17 |
19 |
co2_elevated_stat_arrays | 0.586000 | 0.137 |
| Thaps_hclust_0098 |
|
|
0.0000000015 |
0.17 |
19 |
lowtemp_TMEVA | 0.643000 | 0.12 |
| Thaps_hclust_0098 |
|
|
0.0000000015 |
0.17 |
19 |
highpH_TMEVA | 0.553000 | -0.095 |
| Thaps_hclust_0098 |
|
|
0.0000000015 |
0.17 |
19 |
co2_elevated_expo_arrays | 0.159000 | 0.201 |
| Thaps_hclust_0098 |
|
|
0.0000000015 |
0.17 |
19 |
lowFe_TMEVA | 0.508000 | 0.187 |
| Thaps_hclust_0098 |
|
|
0.0000000015 |
0.17 |
19 |
exponential_vs_stationary_24light | 0.030300 | 0.597 |
| Title | Cluster Plot | Dendrogram | e-value | e-value | e-value | Condition | Condition FDR | Condition Difference |
|---|---|---|---|---|---|---|---|---|
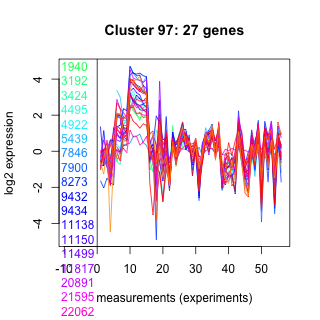
| Thaps_hclust_0097 |
 |
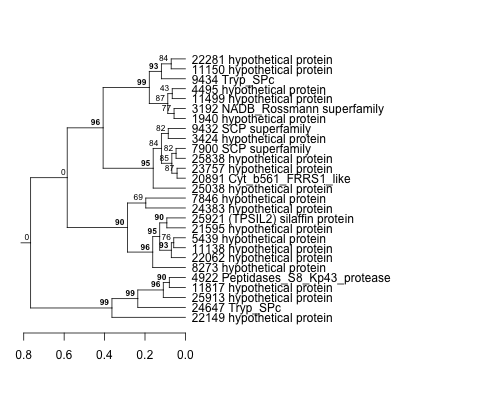 |
0.02 |
1.4 |
3.4 |
lowFe_TMEVA | 0.215000 | -0.302 |
| Thaps_hclust_0097 |
|
|
0.02 |
1.4 |
3.4 |
exponential_vs_stationary_24light | 0.000581 | 1.74 |
| Thaps_hclust_0097 |
|
|
0.02 |
1.4 |
3.4 |
lowN_TMEVA | 0.411000 | -0.263 |
| Thaps_hclust_0097 |
|
|
0.02 |
1.4 |
3.4 |
diel_exponential_vs_stationary | 0.000602 | 0.528 |
| Thaps_hclust_0097 |
|
|
0.02 |
1.4 |
3.4 |
lowSi_TMEVA | 0.002330 | -1.01 |
| Thaps_hclust_0097 |
|
|
0.02 |
1.4 |
3.4 |
highlight_arrays | 0.001570 | -0.403 |
| Thaps_hclust_0097 |
|
|
0.02 |
1.4 |
3.4 |
diel_light_vs_dark | 0.011200 | 0.423 |
| Thaps_hclust_0097 |
|
|
0.02 |
1.4 |
3.4 |
lowFe_KTKB_Day3 | 0.656000 | -0.103 |
| Thaps_hclust_0097 |
|
|
0.02 |
1.4 |
3.4 |
lowFe_KTKB_Day5 | 0.385000 | -0.155 |
| Thaps_hclust_0097 |
|
|
0.02 |
1.4 |
3.4 |
BaP | 0.280000 | -0.21 |
| Thaps_hclust_0097 |
|
|
0.02 |
1.4 |
3.4 |
exponential_vs_stationary_24highlight | 0.000526 | 0.461 |
| Thaps_hclust_0097 |
|
|
0.02 |
1.4 |
3.4 |
co2_elevated_stat_arrays | 0.000658 | 1.21 |
| Thaps_hclust_0097 |
|
|
0.02 |
1.4 |
3.4 |
lowtemp_TMEVA | 0.966000 | 0.0114 |
| Thaps_hclust_0097 |
|
|
0.02 |
1.4 |
3.4 |
highpH_TMEVA | 0.000725 | -0.494 |
| Thaps_hclust_0097 |
|
|
0.02 |
1.4 |
3.4 |
co2_elevated_expo_arrays | 0.001390 | 0.796 |
| Title | Cluster Plot | Dendrogram | e-value | e-value | e-value | Condition | Condition FDR | Condition Difference |
|---|---|---|---|---|---|---|---|---|
| Thaps_hclust_0096 |
 |
 |
0.0000028 |
0.9 |
0.38 |
co2_elevated_expo_arrays | 0.003850 | 0.31 |
| Thaps_hclust_0096 |
|
|
0.0000028 |
0.9 |
0.38 |
lowFe_TMEVA | 0.888000 | -0.0538 |
| Thaps_hclust_0096 |
|
|
0.0000028 |
0.9 |
0.38 |
exponential_vs_stationary_24light | 0.902000 | 0.0404 |
| Thaps_hclust_0096 |
|
|
0.0000028 |
0.9 |
0.38 |
lowN_TMEVA | 0.996000 | -0.00685 |
| Thaps_hclust_0096 |
|
|
0.0000028 |
0.9 |
0.38 |
diel_exponential_vs_stationary | 0.489000 | -0.116 |
| Thaps_hclust_0096 |
|
|
0.0000028 |
0.9 |
0.38 |
lowSi_TMEVA | 1.000000 | -0.038 |
| Thaps_hclust_0096 |
|
|
0.0000028 |
0.9 |
0.38 |
highlight_arrays | 0.040800 | 0.255 |
| Thaps_hclust_0096 |
|
|
0.0000028 |
0.9 |
0.38 |
diel_light_vs_dark | 0.188000 | 0.221 |
| Thaps_hclust_0096 |
|
|
0.0000028 |
0.9 |
0.38 |
lowFe_KTKB_Day3 | 0.114000 | -0.295 |
| Thaps_hclust_0096 |
|
|
0.0000028 |
0.9 |
0.38 |
lowFe_KTKB_Day5 | 0.765000 | 0.0586 |
| Thaps_hclust_0096 |
|
|
0.0000028 |
0.9 |
0.38 |
BaP | 0.061500 | -0.319 |
| Thaps_hclust_0096 |
|
|
0.0000028 |
0.9 |
0.38 |
exponential_vs_stationary_24highlight | 0.104000 | -0.138 |
| Thaps_hclust_0096 |
|
|
0.0000028 |
0.9 |
0.38 |
co2_elevated_stat_arrays | 0.012600 | 0.434 |
| Thaps_hclust_0096 |
|
|
0.0000028 |
0.9 |
0.38 |
lowtemp_TMEVA | 0.520000 | -0.14 |
| Thaps_hclust_0096 |
|
|
0.0000028 |
0.9 |
0.38 |
highpH_TMEVA | 0.006190 | -0.341 |
| Title | Cluster Plot | Dendrogram | e-value | e-value | e-value | Condition | Condition FDR | Condition Difference |
|---|---|---|---|---|---|---|---|---|
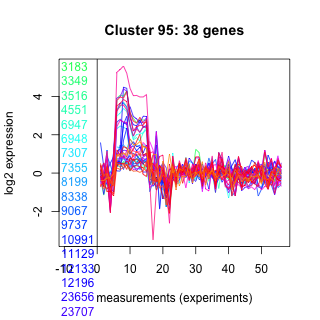
| Thaps_hclust_0095 |
 |
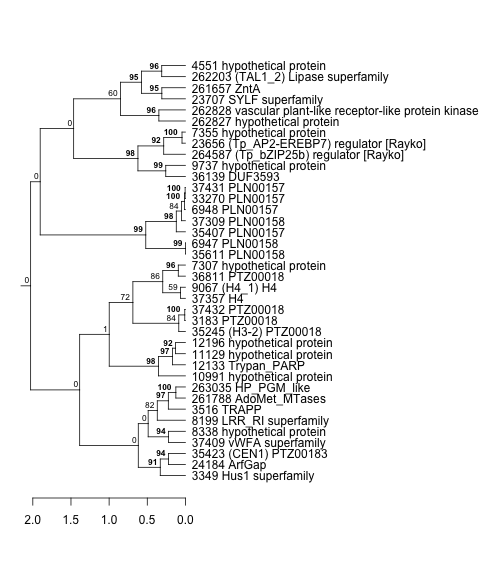 |
5.3e-28 |
1.7e-25 |
1.6e-17 |
highpH_TMEVA | 0.722000 | -0.0542 |
| Thaps_hclust_0095 |
|
|
5.3e-28 |
1.7e-25 |
1.6e-17 |
co2_elevated_expo_arrays | 0.629000 | 0.101 |
| Thaps_hclust_0095 |
|
|
5.3e-28 |
1.7e-25 |
1.6e-17 |
lowFe_TMEVA | 0.356000 | -0.218 |
| Thaps_hclust_0095 |
|
|
5.3e-28 |
1.7e-25 |
1.6e-17 |
exponential_vs_stationary_24light | 0.650000 | 0.137 |
| Thaps_hclust_0095 |
|
|
5.3e-28 |
1.7e-25 |
1.6e-17 |
lowN_TMEVA | 0.894000 | 0.0437 |
| Thaps_hclust_0095 |
|
|
5.3e-28 |
1.7e-25 |
1.6e-17 |
diel_exponential_vs_stationary | 0.096000 | -0.207 |
| Thaps_hclust_0095 |
|
|
5.3e-28 |
1.7e-25 |
1.6e-17 |
lowSi_TMEVA | 0.007000 | -0.745 |
| Thaps_hclust_0095 |
|
|
5.3e-28 |
1.7e-25 |
1.6e-17 |
highlight_arrays | 0.389000 | -0.109 |
| Thaps_hclust_0095 |
|
|
5.3e-28 |
1.7e-25 |
1.6e-17 |
diel_light_vs_dark | 0.144000 | 0.223 |
| Thaps_hclust_0095 |
|
|
5.3e-28 |
1.7e-25 |
1.6e-17 |
lowFe_KTKB_Day3 | 0.157000 | 0.238 |
| Thaps_hclust_0095 |
|
|
5.3e-28 |
1.7e-25 |
1.6e-17 |
lowFe_KTKB_Day5 | 0.865000 | -0.0291 |
| Thaps_hclust_0095 |
|
|
5.3e-28 |
1.7e-25 |
1.6e-17 |
BaP | 0.183000 | -0.209 |
| Thaps_hclust_0095 |
|
|
5.3e-28 |
1.7e-25 |
1.6e-17 |
exponential_vs_stationary_24highlight | 0.263000 | 0.0886 |
| Thaps_hclust_0095 |
|
|
5.3e-28 |
1.7e-25 |
1.6e-17 |
co2_elevated_stat_arrays | 0.999000 | -0.000503 |
| Thaps_hclust_0095 |
|
|
5.3e-28 |
1.7e-25 |
1.6e-17 |
lowtemp_TMEVA | 0.599000 | 0.106 |
| Title | Cluster Plot | Dendrogram | e-value | e-value | e-value | Condition | Condition FDR | Condition Difference |
|---|---|---|---|---|---|---|---|---|
| Thaps_hclust_0094 |
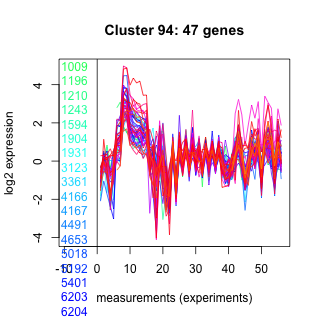 |
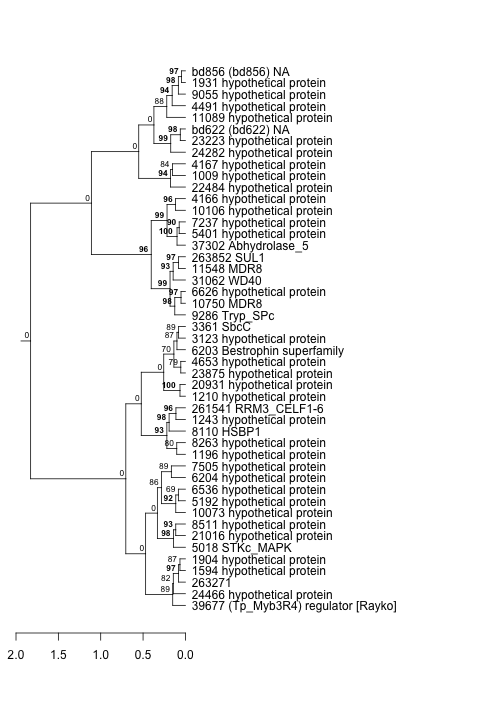 |
0.0000000025 |
0.000014 |
0.0000045 |
lowtemp_TMEVA | 0.002670 | -0.448 |
| Thaps_hclust_0094 |
|
|
0.0000000025 |
0.000014 |
0.0000045 |
highpH_TMEVA | 0.000725 | -0.883 |
| Thaps_hclust_0094 |
|
|
0.0000000025 |
0.000014 |
0.0000045 |
co2_elevated_expo_arrays | 0.001390 | 0.699 |
| Thaps_hclust_0094 |
|
|
0.0000000025 |
0.000014 |
0.0000045 |
lowFe_TMEVA | 0.951000 | -0.0271 |
| Thaps_hclust_0094 |
|
|
0.0000000025 |
0.000014 |
0.0000045 |
exponential_vs_stationary_24light | 0.000581 | 0.852 |
| Thaps_hclust_0094 |
|
|
0.0000000025 |
0.000014 |
0.0000045 |
lowN_TMEVA | 0.310000 | -0.266 |
| Thaps_hclust_0094 |
|
|
0.0000000025 |
0.000014 |
0.0000045 |
diel_exponential_vs_stationary | 0.002970 | -0.34 |
| Thaps_hclust_0094 |
|
|
0.0000000025 |
0.000014 |
0.0000045 |
lowSi_TMEVA | 0.001350 | -0.996 |
| Thaps_hclust_0094 |
|
|
0.0000000025 |
0.000014 |
0.0000045 |
highlight_arrays | 0.002840 | -0.294 |
| Thaps_hclust_0094 |
|
|
0.0000000025 |
0.000014 |
0.0000045 |
diel_light_vs_dark | 0.000485 | 1.17 |