Hierarchical Clusters
Displaying 6601 - 6700 of 7500
| Title | Cluster Plot | Dendrogram | e-value | e-value | e-value | Condition | Condition FDR | Condition Difference |
|---|---|---|---|---|---|---|---|---|
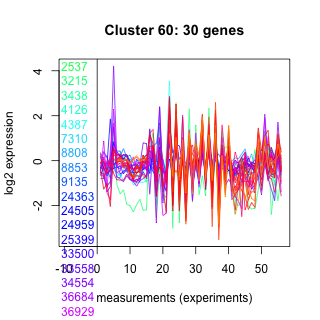
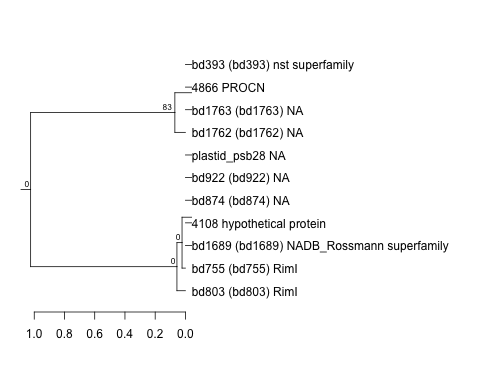
| Thaps_hclust_0060 |
 |
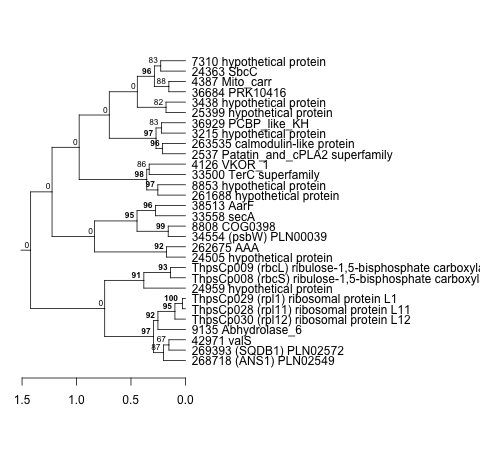 |
0.00000047 |
0.00077 |
0.0075 |
BaP | 0.001910 | -0.537 |
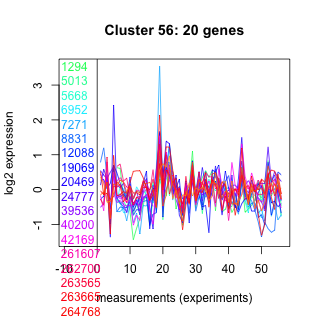
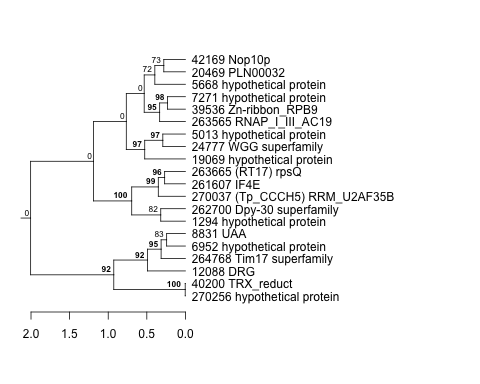
| Thaps_hclust_0060 |
|
|
0.00000047 |
0.00077 |
0.0075 |
exponential_vs_stationary_24highlight | 0.253000 | 0.0991 |
| Thaps_hclust_0060 |
|
|
0.00000047 |
0.00077 |
0.0075 |
co2_elevated_stat_arrays | 0.481000 | 0.163 |
| Thaps_hclust_0060 |
|
|
0.00000047 |
0.00077 |
0.0075 |
lowtemp_TMEVA | 0.000735 | 0.726 |
| Thaps_hclust_0060 |
|
|
0.00000047 |
0.00077 |
0.0075 |
highpH_TMEVA | 0.066600 | -0.24 |
| Thaps_hclust_0060 |
|
|
0.00000047 |
0.00077 |
0.0075 |
co2_elevated_expo_arrays | 0.334000 | 0.152 |
| Thaps_hclust_0060 |
|
|
0.00000047 |
0.00077 |
0.0075 |
lowFe_TMEVA | 0.275000 | -0.265 |
| Thaps_hclust_0060 |
|
|
0.00000047 |
0.00077 |
0.0075 |
exponential_vs_stationary_24light | 0.056900 | 0.491 |
| Thaps_hclust_0060 |
|
|
0.00000047 |
0.00077 |
0.0075 |
lowN_TMEVA | 0.026800 | -0.562 |
| Thaps_hclust_0060 |
|
|
0.00000047 |
0.00077 |
0.0075 |
diel_exponential_vs_stationary | 0.000602 | 0.535 |
| Thaps_hclust_0060 |
|
|
0.00000047 |
0.00077 |
0.0075 |
lowSi_TMEVA | 0.478000 | -0.379 |
| Thaps_hclust_0060 |
|
|
0.00000047 |
0.00077 |
0.0075 |
highlight_arrays | 0.000442 | -0.603 |
| Thaps_hclust_0060 |
|
|
0.00000047 |
0.00077 |
0.0075 |
diel_light_vs_dark | 0.000485 | -1.68 |
| Thaps_hclust_0060 |
|
|
0.00000047 |
0.00077 |
0.0075 |
lowFe_KTKB_Day3 | 0.213000 | 0.238 |
| Thaps_hclust_0060 |
|
|
0.00000047 |
0.00077 |
0.0075 |
lowFe_KTKB_Day5 | 0.004170 | 0.433 |
| Title | Cluster Plot | Dendrogram | e-value | e-value | e-value | Condition | Condition FDR | Condition Difference |
|---|---|---|---|---|---|---|---|---|
| Thaps_hclust_0059 |
 |
 |
0.0000000000000026 |
0.000000000024 |
0.0000014 |
lowFe_KTKB_Day5 | 0.003410 | 0.343 |
| Thaps_hclust_0059 |
|
|
0.0000000000000026 |
0.000000000024 |
0.0000014 |
BaP | 0.071500 | -0.26 |
| Thaps_hclust_0059 |
|
|
0.0000000000000026 |
0.000000000024 |
0.0000014 |
exponential_vs_stationary_24highlight | 0.000526 | 0.388 |
| Thaps_hclust_0059 |
|
|
0.0000000000000026 |
0.000000000024 |
0.0000014 |
co2_elevated_stat_arrays | 0.299000 | 0.2 |
| Thaps_hclust_0059 |
|
|
0.0000000000000026 |
0.000000000024 |
0.0000014 |
lowtemp_TMEVA | 0.000735 | 0.659 |
| Thaps_hclust_0059 |
|
|
0.0000000000000026 |
0.000000000024 |
0.0000014 |
highpH_TMEVA | 0.026800 | -0.243 |
| Thaps_hclust_0059 |
|
|
0.0000000000000026 |
0.000000000024 |
0.0000014 |
co2_elevated_expo_arrays | 0.129000 | 0.17 |
| Thaps_hclust_0059 |
|
|
0.0000000000000026 |
0.000000000024 |
0.0000014 |
lowFe_TMEVA | 0.356000 | -0.208 |
| Thaps_hclust_0059 |
|
|
0.0000000000000026 |
0.000000000024 |
0.0000014 |
exponential_vs_stationary_24light | 0.000581 | 1.43 |
| Thaps_hclust_0059 |
|
|
0.0000000000000026 |
0.000000000024 |
0.0000014 |
lowN_TMEVA | 0.001190 | -0.856 |
| Thaps_hclust_0059 |
|
|
0.0000000000000026 |
0.000000000024 |
0.0000014 |
diel_exponential_vs_stationary | 0.000602 | 0.705 |
| Thaps_hclust_0059 |
|
|
0.0000000000000026 |
0.000000000024 |
0.0000014 |
lowSi_TMEVA | 0.006120 | -0.68 |
| Thaps_hclust_0059 |
|
|
0.0000000000000026 |
0.000000000024 |
0.0000014 |
highlight_arrays | 0.000442 | -0.831 |
| Thaps_hclust_0059 |
|
|
0.0000000000000026 |
0.000000000024 |
0.0000014 |
diel_light_vs_dark | 0.000485 | -1.69 |
| Thaps_hclust_0059 |
|
|
0.0000000000000026 |
0.000000000024 |
0.0000014 |
lowFe_KTKB_Day3 | 0.000862 | 0.635 |
| Title | Cluster Plot | Dendrogram | e-value | e-value | e-value | Condition | Condition FDR | Condition Difference |
|---|---|---|---|---|---|---|---|---|
| Thaps_hclust_0058 |
 |
 |
0.000000037 |
0.000000014 |
0.00000069 |
lowFe_KTKB_Day3 | 0.106000 | -0.242 |
| Thaps_hclust_0058 |
|
|
0.000000037 |
0.000000014 |
0.00000069 |
lowFe_KTKB_Day5 | 0.646000 | -0.0712 |
| Thaps_hclust_0058 |
|
|
0.000000037 |
0.000000014 |
0.00000069 |
BaP | 0.268000 | 0.163 |
| Thaps_hclust_0058 |
|
|
0.000000037 |
0.000000014 |
0.00000069 |
exponential_vs_stationary_24highlight | 0.000526 | 0.403 |
| Thaps_hclust_0058 |
|
|
0.000000037 |
0.000000014 |
0.00000069 |
co2_elevated_stat_arrays | 0.724000 | 0.0915 |
| Thaps_hclust_0058 |
|
|
0.000000037 |
0.000000014 |
0.00000069 |
lowtemp_TMEVA | 0.000735 | -0.976 |
| Thaps_hclust_0058 |
|
|
0.000000037 |
0.000000014 |
0.00000069 |
highpH_TMEVA | 0.731000 | 0.0511 |
| Thaps_hclust_0058 |
|
|
0.000000037 |
0.000000014 |
0.00000069 |
co2_elevated_expo_arrays | 0.563000 | 0.105 |
| Thaps_hclust_0058 |
|
|
0.000000037 |
0.000000014 |
0.00000069 |
lowFe_TMEVA | 0.001040 | -0.637 |
| Thaps_hclust_0058 |
|
|
0.000000037 |
0.000000014 |
0.00000069 |
exponential_vs_stationary_24light | 0.000581 | 2.2 |
| Thaps_hclust_0058 |
|
|
0.000000037 |
0.000000014 |
0.00000069 |
lowN_TMEVA | 0.013600 | -0.527 |
| Thaps_hclust_0058 |
|
|
0.000000037 |
0.000000014 |
0.00000069 |
diel_exponential_vs_stationary | 0.000602 | 2.64 |
| Thaps_hclust_0058 |
|
|
0.000000037 |
0.000000014 |
0.00000069 |
lowSi_TMEVA | 0.001350 | -0.989 |
| Thaps_hclust_0058 |
|
|
0.000000037 |
0.000000014 |
0.00000069 |
highlight_arrays | 0.000442 | -1.16 |
| Thaps_hclust_0058 |
|
|
0.000000037 |
0.000000014 |
0.00000069 |
diel_light_vs_dark | 0.636000 | 0.0822 |
| Title | Cluster Plot | Dendrogram | e-value | e-value | e-value | Condition | Condition FDR | Condition Difference |
|---|---|---|---|---|---|---|---|---|
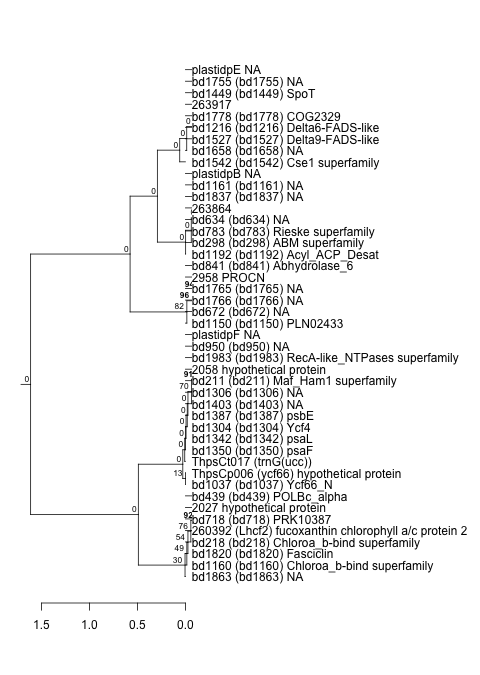
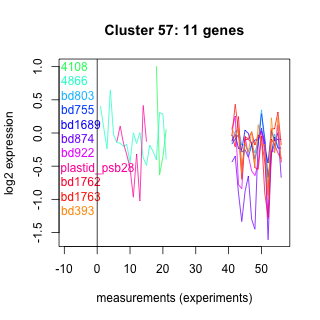
| Thaps_hclust_0057 |
 |
 |
1.5 |
1.7 |
12 |
diel_light_vs_dark | 1.000000 | |
| Thaps_hclust_0057 |
|
|
1.5 |
1.7 |
12 |
lowFe_KTKB_Day3 | 0.604000 | -0.181 |
| Thaps_hclust_0057 |
|
|
1.5 |
1.7 |
12 |
lowFe_KTKB_Day5 | 0.301000 | -0.278 |
| Thaps_hclust_0057 |
|
|
1.5 |
1.7 |
12 |
BaP | 0.969000 | -0.0164 |
| Thaps_hclust_0057 |
|
|
1.5 |
1.7 |
12 |
exponential_vs_stationary_24highlight | 0.345000 | 0.14 |
| Thaps_hclust_0057 |
|
|
1.5 |
1.7 |
12 |
co2_elevated_stat_arrays | 0.053100 | -0.525 |
| Thaps_hclust_0057 |
|
|
1.5 |
1.7 |
12 |
lowtemp_TMEVA | 0.941000 | -0.0304 |
| Thaps_hclust_0057 |
|
|
1.5 |
1.7 |
12 |
highpH_TMEVA | 0.051200 | 0.407 |
| Thaps_hclust_0057 |
|
|
1.5 |
1.7 |
12 |
co2_elevated_expo_arrays | 0.911000 | -0.056 |
| Thaps_hclust_0057 |
|
|
1.5 |
1.7 |
12 |
lowFe_TMEVA | 0.853000 | 0.0784 |
| Thaps_hclust_0057 |
|
|
1.5 |
1.7 |
12 |
exponential_vs_stationary_24light | 0.679000 | 0.197 |
| Thaps_hclust_0057 |
|
|
1.5 |
1.7 |
12 |
lowN_TMEVA | 0.581000 | -0.237 |
| Thaps_hclust_0057 |
|
|
1.5 |
1.7 |
12 |
diel_exponential_vs_stationary | 1.000000 | |
| Thaps_hclust_0057 |
|
|
1.5 |
1.7 |
12 |
lowSi_TMEVA | 0.259000 | 0.65 |
| Thaps_hclust_0057 |
|
|
1.5 |
1.7 |
12 |
highlight_arrays | 0.942000 | -0.0176 |
| Title | Cluster Plot | Dendrogram | e-value | e-value | e-value | Condition | Condition FDR | Condition Difference |
|---|---|---|---|---|---|---|---|---|
| Thaps_hclust_0056 |
 |
 |
0.0000000078 |
0.077 |
1 |
diel_light_vs_dark | 0.379000 | 0.199 |
| Thaps_hclust_0056 |
|
|
0.0000000078 |
0.077 |
1 |
lowFe_KTKB_Day3 | 0.089300 | -0.39 |
| Thaps_hclust_0056 |
|
|
0.0000000078 |
0.077 |
1 |
lowFe_KTKB_Day5 | 0.420000 | -0.169 |
| Thaps_hclust_0056 |
|
|
0.0000000078 |
0.077 |
1 |
BaP | 0.060200 | 0.401 |
| Thaps_hclust_0056 |
|
|
0.0000000078 |
0.077 |
1 |
exponential_vs_stationary_24highlight | 0.740000 | -0.0407 |
| Thaps_hclust_0056 |
|
|
0.0000000078 |
0.077 |
1 |
co2_elevated_stat_arrays | 0.169000 | 0.309 |
| Thaps_hclust_0056 |
|
|
0.0000000078 |
0.077 |
1 |
lowtemp_TMEVA | 0.042100 | 0.525 |
| Thaps_hclust_0056 |
|
|
0.0000000078 |
0.077 |
1 |
highpH_TMEVA | 0.466000 | 0.126 |
| Thaps_hclust_0056 |
|
|
0.0000000078 |
0.077 |
1 |
co2_elevated_expo_arrays | 0.926000 | -0.0471 |
| Thaps_hclust_0056 |
|
|
0.0000000078 |
0.077 |
1 |
lowFe_TMEVA | 0.857000 | 0.0696 |
| Thaps_hclust_0056 |
|
|
0.0000000078 |
0.077 |
1 |
exponential_vs_stationary_24light | 0.902000 | -0.0455 |
| Thaps_hclust_0056 |
|
|
0.0000000078 |
0.077 |
1 |
lowN_TMEVA | 0.505000 | 0.242 |
| Thaps_hclust_0056 |
|
|
0.0000000078 |
0.077 |
1 |
diel_exponential_vs_stationary | 0.821000 | 0.0487 |
| Thaps_hclust_0056 |
|
|
0.0000000078 |
0.077 |
1 |
lowSi_TMEVA | 0.220000 | -0.559 |
| Thaps_hclust_0056 |
|
|
0.0000000078 |
0.077 |
1 |
highlight_arrays | 0.808000 | 0.0448 |
| Title | Cluster Plot | Dendrogram | e-value | e-value | e-value | Condition | Condition FDR | Condition Difference |
|---|---|---|---|---|---|---|---|---|
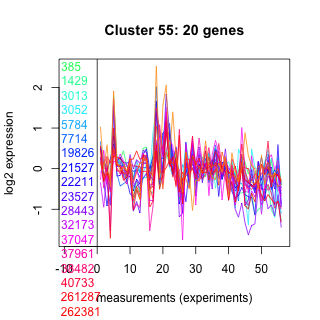
| Thaps_hclust_0055 |
 |
 |
0.000000038 |
0.0000074 |
0.1 |
highlight_arrays | 0.951000 | 0.0117 |
| Thaps_hclust_0055 |
|
|
0.000000038 |
0.0000074 |
0.1 |
diel_light_vs_dark | 0.541000 | 0.151 |
| Thaps_hclust_0055 |
|
|
0.000000038 |
0.0000074 |
0.1 |
lowFe_KTKB_Day3 | 0.087300 | -0.396 |
| Thaps_hclust_0055 |
|
|
0.000000038 |
0.0000074 |
0.1 |
lowFe_KTKB_Day5 | 0.385000 | -0.18 |
| Thaps_hclust_0055 |
|
|
0.000000038 |
0.0000074 |
0.1 |
BaP | 0.007100 | 0.575 |
| Thaps_hclust_0055 |
|
|
0.000000038 |
0.0000074 |
0.1 |
exponential_vs_stationary_24highlight | 0.577000 | 0.0677 |
| Thaps_hclust_0055 |
|
|
0.000000038 |
0.0000074 |
0.1 |
co2_elevated_stat_arrays | 0.476000 | 0.177 |
| Thaps_hclust_0055 |
|
|
0.000000038 |
0.0000074 |
0.1 |
lowtemp_TMEVA | 0.000735 | 0.947 |
| Thaps_hclust_0055 |
|
|
0.000000038 |
0.0000074 |
0.1 |
highpH_TMEVA | 0.053800 | 0.303 |
| Thaps_hclust_0055 |
|
|
0.000000038 |
0.0000074 |
0.1 |
co2_elevated_expo_arrays | 0.898000 | -0.0565 |
| Thaps_hclust_0055 |
|
|
0.000000038 |
0.0000074 |
0.1 |
lowFe_TMEVA | 0.767000 | -0.112 |
| Thaps_hclust_0055 |
|
|
0.000000038 |
0.0000074 |
0.1 |
exponential_vs_stationary_24light | 0.735000 | 0.134 |
| Thaps_hclust_0055 |
|
|
0.000000038 |
0.0000074 |
0.1 |
lowN_TMEVA | 0.852000 | -0.0753 |
| Thaps_hclust_0055 |
|
|
0.000000038 |
0.0000074 |
0.1 |
diel_exponential_vs_stationary | 0.999000 | 0.000455 |
| Thaps_hclust_0055 |
|
|
0.000000038 |
0.0000074 |
0.1 |
lowSi_TMEVA | 0.337000 | -0.481 |
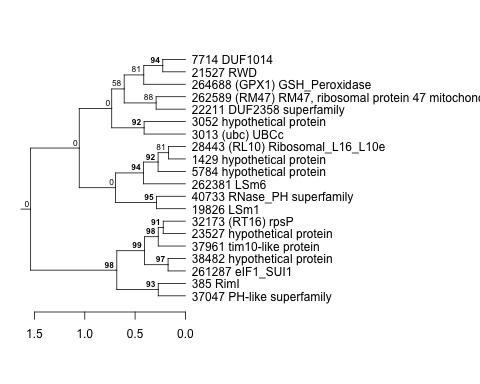
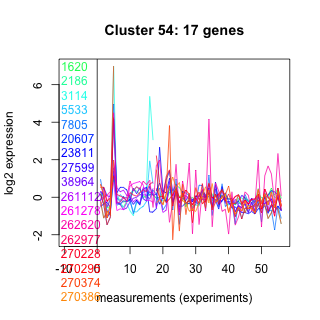
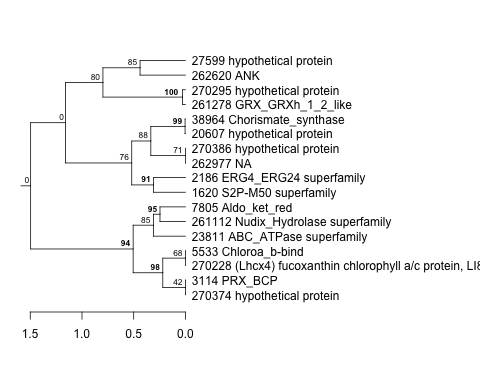
| Title | Cluster Plot | Dendrogram | e-value | e-value | e-value | Condition | Condition FDR | Condition Difference |
|---|---|---|---|---|---|---|---|---|
| Thaps_hclust_0054 |
 |
 |
1.6e-17 |
0.0000000000053 |
0.000000000000024 |
highlight_arrays | 0.244000 | -0.202 |
| Thaps_hclust_0054 |
|
|
1.6e-17 |
0.0000000000053 |
0.000000000000024 |
diel_light_vs_dark | 0.016000 | -0.509 |
| Thaps_hclust_0054 |
|
|
1.6e-17 |
0.0000000000053 |
0.000000000000024 |
lowFe_KTKB_Day3 | 0.001610 | 0.767 |
| Thaps_hclust_0054 |
|
|
1.6e-17 |
0.0000000000053 |
0.000000000000024 |
lowFe_KTKB_Day5 | 0.088000 | 0.367 |
| Thaps_hclust_0054 |
|
|
1.6e-17 |
0.0000000000053 |
0.000000000000024 |
BaP | 0.386000 | 0.215 |
| Thaps_hclust_0054 |
|
|
1.6e-17 |
0.0000000000053 |
0.000000000000024 |
exponential_vs_stationary_24highlight | 0.043700 | 0.228 |
| Thaps_hclust_0054 |
|
|
1.6e-17 |
0.0000000000053 |
0.000000000000024 |
co2_elevated_stat_arrays | 0.856000 | 0.0533 |
| Thaps_hclust_0054 |
|
|
1.6e-17 |
0.0000000000053 |
0.000000000000024 |
lowtemp_TMEVA | 0.000735 | 2.95 |
| Thaps_hclust_0054 |
|
|
1.6e-17 |
0.0000000000053 |
0.000000000000024 |
highpH_TMEVA | 0.358000 | 0.161 |
| Thaps_hclust_0054 |
|
|
1.6e-17 |
0.0000000000053 |
0.000000000000024 |
co2_elevated_expo_arrays | 0.985000 | 0.00824 |