Hierarchical Clusters
Displaying 1001 - 1100 of 28001
| Title | Cluster Plot | Dendrogram | e-value | e-value | e-value | Condition | Condition FDR | Condition Difference |
|---|---|---|---|---|---|---|---|---|
| Thaps_hclust_0064 |
 |
 |
0.000000012 |
0.00000073 |
0.0000002 |
diel_light_vs_dark | 0.000485 | -0.738 |
| Thaps_hclust_0064 |
|
|
0.000000012 |
0.00000073 |
0.0000002 |
lowFe_KTKB_Day3 | 0.266000 | -0.3 |
| Thaps_hclust_0064 |
|
|
0.000000012 |
0.00000073 |
0.0000002 |
lowFe_KTKB_Day5 | 0.561000 | 0.141 |
| Thaps_hclust_0064 |
|
|
0.000000012 |
0.00000073 |
0.0000002 |
BaP | 0.153000 | -0.346 |
| Thaps_hclust_0064 |
|
|
0.000000012 |
0.00000073 |
0.0000002 |
exponential_vs_stationary_24highlight | 0.240000 | 0.143 |
| Thaps_hclust_0064 |
|
|
0.000000012 |
0.00000073 |
0.0000002 |
co2_elevated_stat_arrays | 0.665000 | 0.124 |
| Thaps_hclust_0064 |
|
|
0.000000012 |
0.00000073 |
0.0000002 |
lowtemp_TMEVA | 0.229000 | 0.345 |
| Thaps_hclust_0064 |
|
|
0.000000012 |
0.00000073 |
0.0000002 |
highpH_TMEVA | 0.033100 | -0.371 |
| Thaps_hclust_0064 |
|
|
0.000000012 |
0.00000073 |
0.0000002 |
co2_elevated_expo_arrays | 0.025400 | 0.322 |
| Thaps_hclust_0064 |
|
|
0.000000012 |
0.00000073 |
0.0000002 |
lowFe_TMEVA | 0.625000 | 0.169 |
| Thaps_hclust_0064 |
|
|
0.000000012 |
0.00000073 |
0.0000002 |
exponential_vs_stationary_24light | 0.000581 | 1.3 |
| Thaps_hclust_0064 |
|
|
0.000000012 |
0.00000073 |
0.0000002 |
lowN_TMEVA | 0.341000 | -0.362 |
| Thaps_hclust_0064 |
|
|
0.000000012 |
0.00000073 |
0.0000002 |
diel_exponential_vs_stationary | 0.000602 | 0.962 |
| Thaps_hclust_0064 |
|
|
0.000000012 |
0.00000073 |
0.0000002 |
lowSi_TMEVA | 1.000000 | -0.0228 |
| Thaps_hclust_0064 |
|
|
0.000000012 |
0.00000073 |
0.0000002 |
highlight_arrays | 0.019500 | -0.387 |
| Title | Cluster Plot | Dendrogram | e-value | e-value | e-value | Condition | Condition FDR | Condition Difference |
|---|---|---|---|---|---|---|---|---|
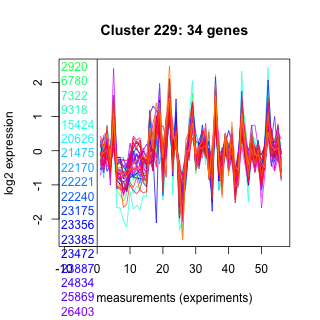
| Thaps_hclust_0229 |
 |
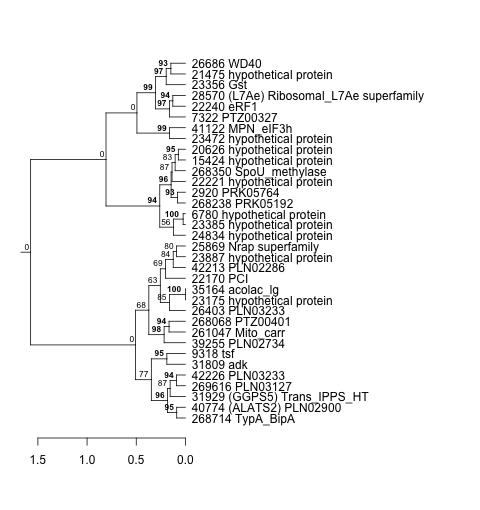 |
9.9e-18 |
0.000000000000034 |
0.0000002 |
diel_light_vs_dark | 0.075900 | -0.27 |
| Thaps_hclust_0229 |
|
|
9.9e-18 |
0.000000000000034 |
0.0000002 |
lowFe_KTKB_Day3 | 0.046800 | 0.345 |
| Thaps_hclust_0229 |
|
|
9.9e-18 |
0.000000000000034 |
0.0000002 |
lowFe_KTKB_Day5 | 0.650000 | 0.0779 |
| Thaps_hclust_0229 |
|
|
9.9e-18 |
0.000000000000034 |
0.0000002 |
BaP | 0.029500 | 0.342 |
| Thaps_hclust_0229 |
|
|
9.9e-18 |
0.000000000000034 |
0.0000002 |
exponential_vs_stationary_24highlight | 0.024400 | 0.176 |
| Thaps_hclust_0229 |
|
|
9.9e-18 |
0.000000000000034 |
0.0000002 |
co2_elevated_stat_arrays | 0.000658 | 0.914 |
| Thaps_hclust_0229 |
|
|
9.9e-18 |
0.000000000000034 |
0.0000002 |
lowtemp_TMEVA | 0.000735 | 0.823 |
| Thaps_hclust_0229 |
|
|
9.9e-18 |
0.000000000000034 |
0.0000002 |
highpH_TMEVA | 0.358000 | -0.122 |
| Thaps_hclust_0229 |
|
|
9.9e-18 |
0.000000000000034 |
0.0000002 |
co2_elevated_expo_arrays | 0.323000 | -0.144 |
| Thaps_hclust_0229 |
|
|
9.9e-18 |
0.000000000000034 |
0.0000002 |
lowFe_TMEVA | 0.651000 | -0.133 |
| Thaps_hclust_0229 |
|
|
9.9e-18 |
0.000000000000034 |
0.0000002 |
exponential_vs_stationary_24light | 0.900000 | 0.0438 |
| Thaps_hclust_0229 |
|
|
9.9e-18 |
0.000000000000034 |
0.0000002 |
lowN_TMEVA | 0.470000 | 0.229 |
| Thaps_hclust_0229 |
|
|
9.9e-18 |
0.000000000000034 |
0.0000002 |
diel_exponential_vs_stationary | 0.693000 | 0.0659 |
| Thaps_hclust_0229 |
|
|
9.9e-18 |
0.000000000000034 |
0.0000002 |
lowSi_TMEVA | 0.500000 | -0.364 |
| Thaps_hclust_0229 |
|
|
9.9e-18 |
0.000000000000034 |
0.0000002 |
highlight_arrays | 0.497000 | -0.0937 |
| Title | Cluster Plot | Dendrogram | e-value | e-value | e-value | Condition | Condition FDR | Condition Difference |
|---|---|---|---|---|---|---|---|---|
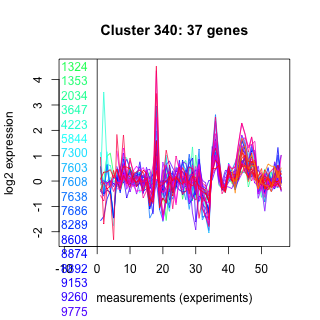
| Thaps_hclust_0340 |
 |
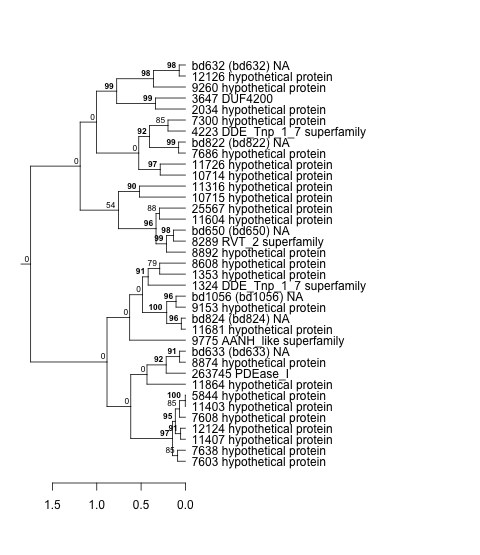 |
0.00000000039 |
0.0000000031 |
0.0000002 |
diel_light_vs_dark | 0.703000 | 0.0759 |
| Thaps_hclust_0340 |
|
|
0.00000000039 |
0.0000000031 |
0.0000002 |
lowFe_KTKB_Day3 | 0.010000 | -0.403 |
| Thaps_hclust_0340 |
|
|
0.00000000039 |
0.0000000031 |
0.0000002 |
lowFe_KTKB_Day5 | 0.001320 | -0.398 |
| Thaps_hclust_0340 |
|
|
0.00000000039 |
0.0000000031 |
0.0000002 |
BaP | 0.691000 | 0.0732 |
| Thaps_hclust_0340 |
|
|
0.00000000039 |
0.0000000031 |
0.0000002 |
exponential_vs_stationary_24highlight | 0.740000 | 0.0296 |
| Thaps_hclust_0340 |
|
|
0.00000000039 |
0.0000000031 |
0.0000002 |
co2_elevated_stat_arrays | 0.125000 | 0.278 |
| Thaps_hclust_0340 |
|
|
0.00000000039 |
0.0000000031 |
0.0000002 |
lowtemp_TMEVA | 0.001430 | -0.584 |
| Thaps_hclust_0340 |
|
|
0.00000000039 |
0.0000000031 |
0.0000002 |
highpH_TMEVA | 1.000000 | -0.000836 |
| Thaps_hclust_0340 |
|
|
0.00000000039 |
0.0000000031 |
0.0000002 |
co2_elevated_expo_arrays | 0.748000 | 0.0831 |
| Thaps_hclust_0340 |
|
|
0.00000000039 |
0.0000000031 |
0.0000002 |
lowFe_TMEVA | 0.379000 | -0.212 |
| Thaps_hclust_0340 |
|
|
0.00000000039 |
0.0000000031 |
0.0000002 |
exponential_vs_stationary_24light | 0.800000 | -0.0856 |
| Thaps_hclust_0340 |
|
|
0.00000000039 |
0.0000000031 |
0.0000002 |
lowN_TMEVA | 0.564000 | 0.19 |
| Thaps_hclust_0340 |
|
|
0.00000000039 |
0.0000000031 |
0.0000002 |
diel_exponential_vs_stationary | 0.681000 | -0.0678 |
| Thaps_hclust_0340 |
|
|
0.00000000039 |
0.0000000031 |
0.0000002 |
lowSi_TMEVA | 1.000000 | -0.0461 |
| Thaps_hclust_0340 |
|
|
0.00000000039 |
0.0000000031 |
0.0000002 |
highlight_arrays | 0.000442 | 0.589 |
| Title | Cluster Plot | Dendrogram | e-value | e-value | e-value | Condition | Condition FDR | Condition Difference |
|---|---|---|---|---|---|---|---|---|
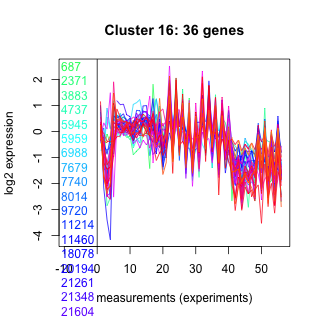
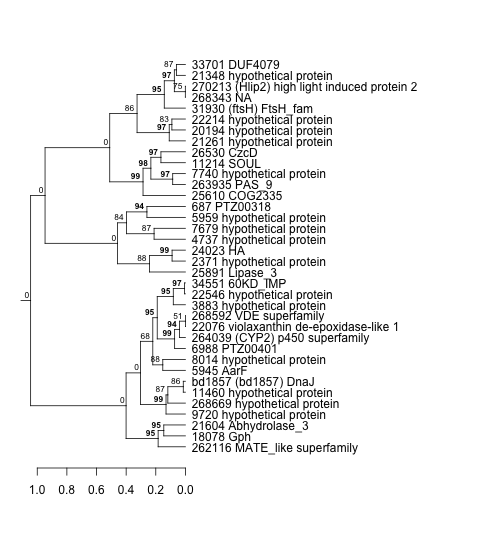
| Thaps_hclust_0016 |
 |
 |
0.000000000083 |
0.00000025 |
0.00000028 |
diel_light_vs_dark | 0.000485 | -1.21 |
| Thaps_hclust_0016 |
|
|
0.000000000083 |
0.00000025 |
0.00000028 |
lowFe_KTKB_Day3 | 0.936000 | 0.0192 |
| Thaps_hclust_0016 |
|
|
0.000000000083 |
0.00000025 |
0.00000028 |
lowFe_KTKB_Day5 | 0.216000 | 0.188 |
| Thaps_hclust_0016 |
|
|
0.000000000083 |
0.00000025 |
0.00000028 |
BaP | 0.305000 | -0.172 |
| Thaps_hclust_0016 |
|
|
0.000000000083 |
0.00000025 |
0.00000028 |
exponential_vs_stationary_24highlight | 0.000526 | 0.416 |
| Thaps_hclust_0016 |
|
|
0.000000000083 |
0.00000025 |
0.00000028 |
co2_elevated_stat_arrays | 0.711000 | -0.095 |
| Thaps_hclust_0016 |
|
|
0.000000000083 |
0.00000025 |
0.00000028 |
lowtemp_TMEVA | 0.578000 | 0.114 |
| Thaps_hclust_0016 |
|
|
0.000000000083 |
0.00000025 |
0.00000028 |
highpH_TMEVA | 0.608000 | 0.0733 |
| Thaps_hclust_0016 |
|
|
0.000000000083 |
0.00000025 |
0.00000028 |
co2_elevated_expo_arrays | 0.833000 | 0.0695 |
| Thaps_hclust_0016 |
|
|
0.000000000083 |
0.00000025 |
0.00000028 |
lowFe_TMEVA | 0.001040 | -0.769 |
| Thaps_hclust_0016 |
|
|
0.000000000083 |
0.00000025 |
0.00000028 |
exponential_vs_stationary_24light | 0.000581 | 1.18 |
| Thaps_hclust_0016 |
|
|
0.000000000083 |
0.00000025 |
0.00000028 |
lowN_TMEVA | 0.001190 | -1.44 |
| Thaps_hclust_0016 |
|
|
0.000000000083 |
0.00000025 |
0.00000028 |
diel_exponential_vs_stationary | 0.000602 | 0.727 |
| Thaps_hclust_0016 |
|
|
0.000000000083 |
0.00000025 |
0.00000028 |
lowSi_TMEVA | 0.001350 | -1.17 |
| Thaps_hclust_0016 |
|
|
0.000000000083 |
0.00000025 |
0.00000028 |
highlight_arrays | 0.001240 | -0.36 |
| Title | Cluster Plot | Dendrogram | e-value | e-value | e-value | Condition | Condition FDR | Condition Difference |
|---|---|---|---|---|---|---|---|---|
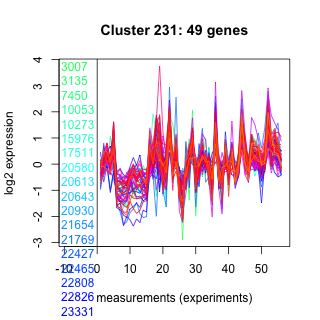
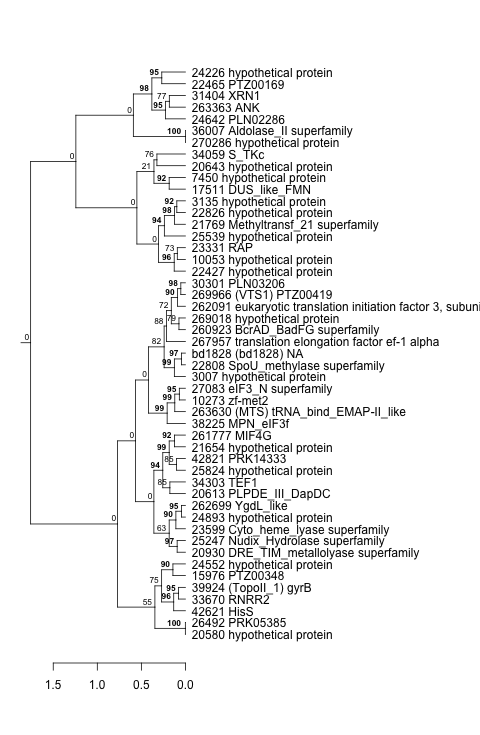
| Thaps_hclust_0231 |
 |
 |
9.5e-23 |
0.000000000000034 |
0.00000039 |
diel_light_vs_dark | 0.052700 | -0.244 |
| Thaps_hclust_0231 |
|
|
9.5e-23 |
0.000000000000034 |
0.00000039 |
lowFe_KTKB_Day3 | 0.062700 | 0.272 |
| Thaps_hclust_0231 |
|
|
9.5e-23 |
0.000000000000034 |
0.00000039 |
lowFe_KTKB_Day5 | 0.345000 | 0.127 |
| Thaps_hclust_0231 |
|
|
9.5e-23 |
0.000000000000034 |
0.00000039 |
BaP | 0.342000 | 0.135 |
| Thaps_hclust_0231 |
|
|
9.5e-23 |
0.000000000000034 |
0.00000039 |
exponential_vs_stationary_24highlight | 0.476000 | 0.052 |
| Thaps_hclust_0231 |
|
|
9.5e-23 |
0.000000000000034 |
0.00000039 |
co2_elevated_stat_arrays | 0.000658 | 0.774 |
| Thaps_hclust_0231 |
|
|
9.5e-23 |
0.000000000000034 |
0.00000039 |
lowtemp_TMEVA | 0.000735 | 0.588 |
| Thaps_hclust_0231 |
|
|
9.5e-23 |
0.000000000000034 |
0.00000039 |
highpH_TMEVA | 0.027300 | -0.234 |
| Thaps_hclust_0231 |
|
|
9.5e-23 |
0.000000000000034 |
0.00000039 |
co2_elevated_expo_arrays | 0.487000 | -0.113 |
| Thaps_hclust_0231 |
|
|
9.5e-23 |
0.000000000000034 |
0.00000039 |
lowFe_TMEVA | 0.823000 | 0.0825 |
| Thaps_hclust_0231 |
|
|
9.5e-23 |
0.000000000000034 |
0.00000039 |
exponential_vs_stationary_24light | 0.576000 | -0.153 |
| Thaps_hclust_0231 |
|
|
9.5e-23 |
0.000000000000034 |
0.00000039 |
lowN_TMEVA | 0.607000 | 0.165 |
| Thaps_hclust_0231 |
|
|
9.5e-23 |
0.000000000000034 |
0.00000039 |
diel_exponential_vs_stationary | 0.196000 | 0.149 |
| Thaps_hclust_0231 |
|
|
9.5e-23 |
0.000000000000034 |
0.00000039 |
lowSi_TMEVA | 1.000000 | -0.0141 |
| Thaps_hclust_0231 |
|
|
9.5e-23 |
0.000000000000034 |
0.00000039 |
highlight_arrays | 0.110000 | -0.169 |
| Title | Cluster Plot | Dendrogram | e-value | e-value | e-value | Condition | Condition FDR | Condition Difference |
|---|---|---|---|---|---|---|---|---|
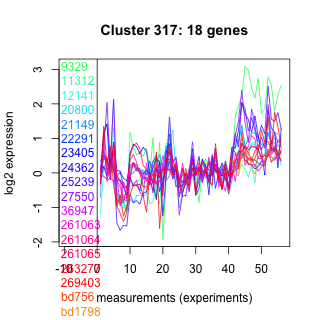
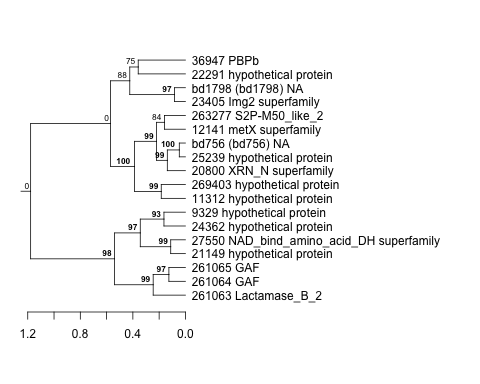
| Thaps_hclust_0317 |
 |
 |
0.000000000082 |
0.00000001 |
0.00000042 |
diel_light_vs_dark | 0.990000 | 0.00462 |
| Thaps_hclust_0317 |
|
|
0.000000000082 |
0.00000001 |
0.00000042 |
lowFe_KTKB_Day3 | 0.639000 | -0.133 |
| Thaps_hclust_0317 |
|
|
0.000000000082 |
0.00000001 |
0.00000042 |
lowFe_KTKB_Day5 | 0.690000 | -0.0909 |
| Thaps_hclust_0317 |
|
|
0.000000000082 |
0.00000001 |
0.00000042 |
BaP | 0.916000 | -0.0306 |
| Thaps_hclust_0317 |
|
|
0.000000000082 |
0.00000001 |
0.00000042 |
exponential_vs_stationary_24highlight | 0.330000 | -0.115 |
| Thaps_hclust_0317 |
|
|
0.000000000082 |
0.00000001 |
0.00000042 |
co2_elevated_stat_arrays | 0.299000 | 0.252 |
| Thaps_hclust_0317 |
|
|
0.000000000082 |
0.00000001 |
0.00000042 |
lowtemp_TMEVA | 0.016200 | 0.677 |
| Thaps_hclust_0317 |
|
|
0.000000000082 |
0.00000001 |
0.00000042 |
highpH_TMEVA | 0.358000 | -0.158 |
| Thaps_hclust_0317 |
|
|
0.000000000082 |
0.00000001 |
0.00000042 |
co2_elevated_expo_arrays | 0.969000 | 0.0244 |
| Thaps_hclust_0317 |
|
|
0.000000000082 |
0.00000001 |
0.00000042 |
lowFe_TMEVA | 0.029400 | 0.574 |
| Thaps_hclust_0317 |
|
|
0.000000000082 |
0.00000001 |
0.00000042 |
exponential_vs_stationary_24light | 0.753000 | -0.132 |
| Thaps_hclust_0317 |
|
|
0.000000000082 |
0.00000001 |
0.00000042 |
lowN_TMEVA | 0.214000 | 0.433 |
| Thaps_hclust_0317 |
|
|
0.000000000082 |
0.00000001 |
0.00000042 |
diel_exponential_vs_stationary | 0.428000 | 0.162 |
| Thaps_hclust_0317 |
|
|
0.000000000082 |
0.00000001 |
0.00000042 |
lowSi_TMEVA | 0.861000 | 0.197 |
| Thaps_hclust_0317 |
|
|
0.000000000082 |
0.00000001 |
0.00000042 |
highlight_arrays | 0.505000 | -0.12 |
| Title | Cluster Plot | Dendrogram | e-value | e-value | e-value | Condition | Condition FDR | Condition Difference |
|---|---|---|---|---|---|---|---|---|
| Thaps_hclust_0117 |
 |
 |
0.0000000000002 |
0.000000021 |
0.00000045 |
diel_light_vs_dark | 0.007840 | -0.519 |
| Thaps_hclust_0117 |
|
|
0.0000000000002 |
0.000000021 |
0.00000045 |
lowFe_KTKB_Day3 | 0.093700 | -0.399 |
| Thaps_hclust_0117 |
|
|
0.0000000000002 |
0.000000021 |
0.00000045 |
lowFe_KTKB_Day5 | 0.646000 | 0.101 |
| Thaps_hclust_0117 |
|
|
0.0000000000002 |
0.000000021 |
0.00000045 |
BaP | 0.002730 | -0.637 |
| Thaps_hclust_0117 |
|
|
0.0000000000002 |
0.000000021 |
0.00000045 |
exponential_vs_stationary_24highlight | 0.000526 | -1.24 |
| Thaps_hclust_0117 |
|
|
0.0000000000002 |
0.000000021 |
0.00000045 |
co2_elevated_stat_arrays | 0.000658 | 0.91 |
| Thaps_hclust_0117 |
|
|
0.0000000000002 |
0.000000021 |
0.00000045 |
lowtemp_TMEVA | 0.036400 | -0.548 |
| Thaps_hclust_0117 |
|
|
0.0000000000002 |
0.000000021 |
0.00000045 |
highpH_TMEVA | 0.000725 | 1.23 |
| Thaps_hclust_0117 |
|
|
0.0000000000002 |
0.000000021 |
0.00000045 |
co2_elevated_expo_arrays | 0.001390 | 0.788 |
| Thaps_hclust_0117 |
|
|
0.0000000000002 |
0.000000021 |
0.00000045 |
lowFe_TMEVA | 0.001040 | 0.941 |