Phatr_bicluster_0213 Residual: 0.25
Phaeodactylum tricornutum
| Title | Residual | Model version | Organism |
|---|---|---|---|
| Phatr_bicluster_0213 | 0.25 | Phaeodactylum tricornutum |
" class="views-fluidgrid-wrapper clear-block">
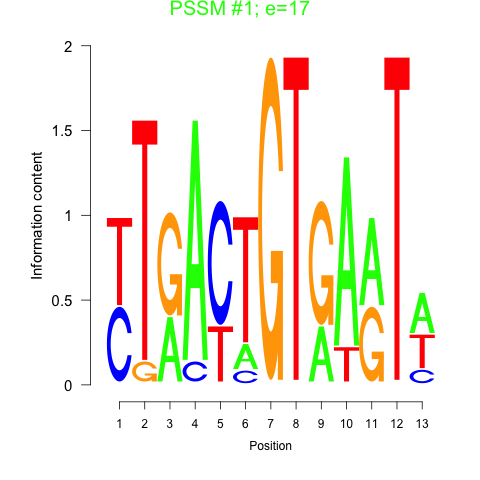
Motif 1 
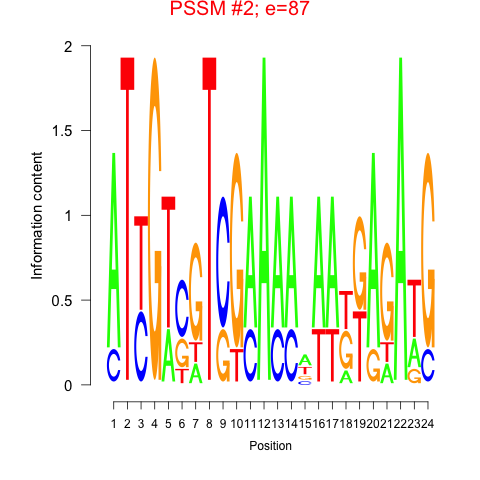
Motif 2 
Displaying 1 - 22 of 22
" class="views-fluidgrid-wrapper clear-block">
PHATRDRAFT_32914 camk family protein kinase (PKc_like superfamily)
PHATRDRAFT_41238 non-ribosomal peptide synthase (FAAL)
PHATRDRAFT_43244 v-snare family protein
PHATRDRAFT_44028 (Lipase superfamily)
PHATRDRAFT_44029 heat shock transcription factor (HSF_DNA-bind)
PHATRDRAFT_44705 m6 (immune inhibitor a) family (M6dom_TIGR03296)
PHATRDRAFT_44761 -like protein with 3 ccch rna binding domains involved in rna metabolism
PHATRDRAFT_45839 hemolysin iii-like protein (COG1272)
PHATRDRAFT_45940 isoform cra_c
PHATRDRAFT_46747 methylase involved in ubiquinone menaquinone biosynthesis (AdoMet_MTases)
PHATRDRAFT_46943 plant late embryo abundantrelated family member (lea-1)
PHATRDRAFT_47114 lipopolysaccharide a protein (CAP10 superfamily)
PHATRDRAFT_48017 serine threonine kinase family protein (TPR_12)
| GO ID | Go Term | p-value | q-value | Cluster |
|---|---|---|---|---|
| GO:0006629 | lipid metabolism | 0.0220418 | 1 | Phatr_bicluster_0213 |
| GO:0008152 | metabolism | 0.0453737 | 1 | Phatr_bicluster_0213 |
| GO:0006468 | protein amino acid phosphorylation | 0.195192 | 1 | Phatr_bicluster_0213 |
| GO:0006355 | regulation of transcription, DNA-dependent | 0.24283 | 1 | Phatr_bicluster_0213 |
Comments