Thaps_bicluster_0192 Residual: 0.36
Thalassiosira pseudonana
| Title | Residual | Model version | Organism |
|---|---|---|---|
| Thaps_bicluster_0192 | 0.36 | Thalassiosira pseudonana |
" class="views-fluidgrid-wrapper clear-block">
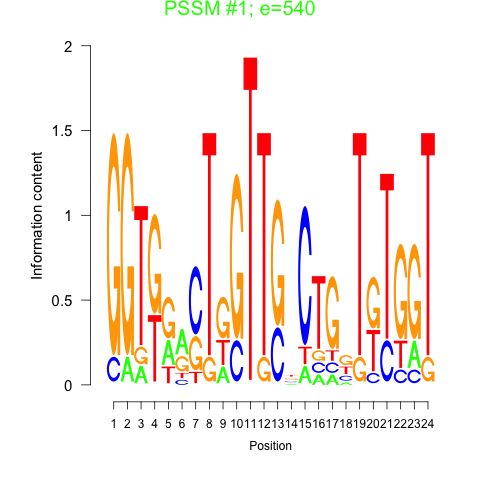
Motif 1 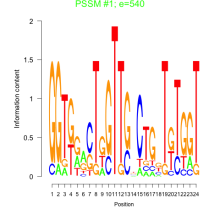
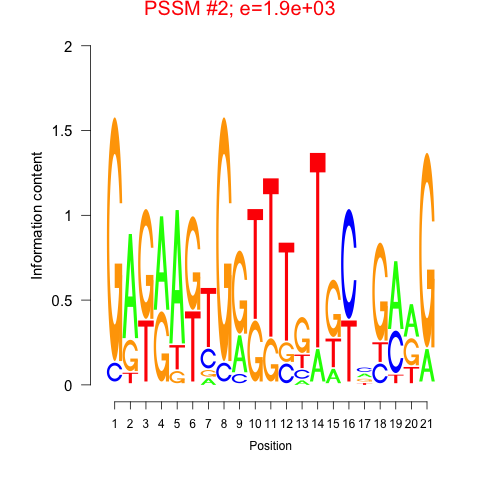
Motif 2 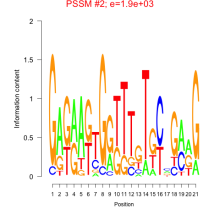
Displaying 1 - 19 of 19
" class="views-fluidgrid-wrapper clear-block">
14597 SrmB
20583 hypothetical protein
20731 Mito_carr
22200 hypothetical protein
23718 hypothetical protein
24977 TRAUB superfamily
25582 hypothetical protein
26022 Pam16 superfamily
262862 rimM
26366 Mito_carr
26941 (NIR_1) PRK14989
32066 Mito_carr
33682 (Tp_sigma70.3a) Sig70-cyanoRpoD
35041 COG1094
36539 hypothetical protein
3919 Nop25
39286 Uup
4408 hypothetical protein
5130 COG0790
| GO ID | Go Term | p-value | q-value | Cluster |
|---|---|---|---|---|
| GO:0006118 | electron transport | 0.399203 | 1 | Thaps_bicluster_0192 |
| GO:0006457 | protein folding | 0.217609 | 1 | Thaps_bicluster_0192 |
| GO:0006355 | regulation of transcription, DNA-dependent | 0.446038 | 1 | Thaps_bicluster_0192 |
| GO:0007046 | ribosome biogenesis | 0.00742418 | 1 | Thaps_bicluster_0192 |
| GO:0006364 | rRNA processing | 0.0147993 | 1 | Thaps_bicluster_0192 |
| GO:0006352 | transcription initiation | 0.0239497 | 1 | Thaps_bicluster_0192 |
| GO:0006810 | transport | 0.00383948 | 1 | Thaps_bicluster_0192 |
Comments