Module Page Help
What is a module?
Regulatory units (modules) in the Network Portal are based on the network inference algorithm used. For the current version, modules are based on cMonkey modules and Inferelator regulatory influences on these modules. More specifically, module refers to set of genes that are conditionally co-regulated under subset of the conditions. Identification of modules integrates co-expression, de-novo motif identification, and other functional associations such as operon information and protein-protein interactions.
Expression Profiles
Expression profiles is a plot of the expression ratios (log10) of the module's genes, over all subset of the conditions included in the module. The X-axis represent conditions and the Y-axis represents log10 expression ratios. Each gene is plotted as line plot with different colors. Colored legend for the lines are presented under the plot. This plot is dynamic. Clicking on the gene names in the legend will show/hide the plot for that particular gene. A tooltip will show expression ratio information if you mouseover the lines in the plot.
Motif Locations
Location of the Identified motifs for the module in the upstream regions of the member genes are shown under the expression profiles plot. This plot shows the diagram of the upstream positions of the motifs, colored red and green for motifs #1, and 2, respectively. Intensity of the color is proportional to the significance of the occurence of that motif at a given location. Motifs on the forward and reverse strand are represented over and under the line respectively.
Regulators
For each module, single or AND logic connected regulatory influences are listed under the regulators tab. These regulatory influences are identified by Inferelator. Table shows name of the regulator and its type. tf: Transcription factor, ef: Environmental factor and combiner:Combinatorial influence of a tf or an ef through logic gate. Tabel is sortable by clicking on the arrows next to column headers.
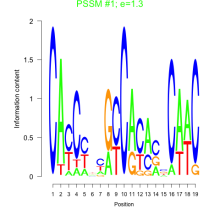
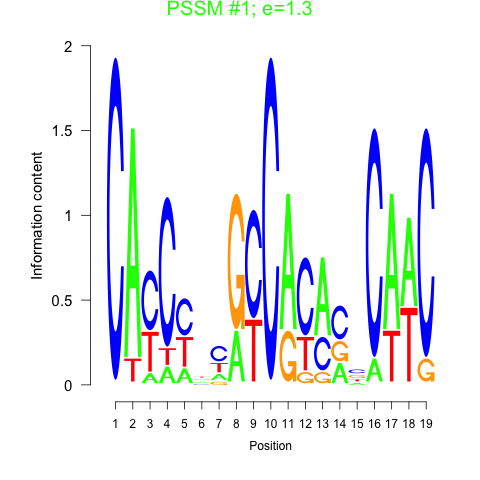
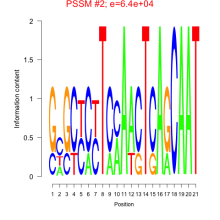
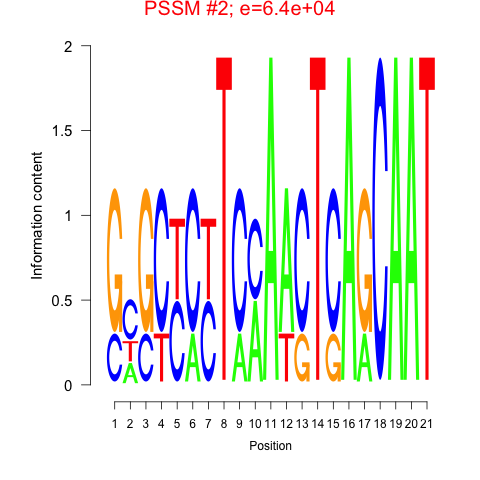
Motifs
Transcription factor binding motifs help to elucidate regulatory mechanism. cMonkey integrates powerful de novo motif detection to identify conditionally co-regulated sets of genes. De novo predicted motifs for each module are listed in the module page as motif logo images along with associated prediction statistics (e-values). The main module page also shows the location of these motifs within the upstream sequences of the module member genes.
Comments