Network Portal Help
 Please visit screencast tutorials page to quickly learn how to use Gaggle and Gaggle workspace
Discover Network Portal
What is Network Portal
The Network Portal is a database of gene transcription regulatory networks and enables exploration, annotation and comparative analysis.
Deciphering the complexity of biological systems requires a systems-level view of regulatory players and their interactions. However, inference of these complex interactions is challenging, and further, visualizing and analyzing these interactions often requires advanced computational expertise, tools and resources.
Network Portal provides analysis and visualization tools for selected gene regulatory networks to aid researchers in biological discovery and hypothesis development. It provides a user-friendly interface, extensive search capabilities and a number of visualization tools. We are also constantly adding regulatory networks for new species. Increasing the number of network models will also enable comparative network biology. We are also developing tools for comparing network models and these will be integrated into the portal as soon as they are available.
The Network Portal also acts as a gateway for the Gaggle Workspace. Gaggle Workspace makes the life of researchers easier by taking over the burden of repetitive analysis tasks. Integration with Network Portal provides full access to automated analysis of network models and associated biological information.
Navigating Gene Pages
Network Tab
If the gene is associated with a regulon(s), its connection to given regulons along with other members of that regulon are shown as a network using CytoscapeWeb. In this view, green circular nodes represent regulon member genes, purple diamonds represent regulon motifs and red triangles represent regulators. Each node is connected to regulon(s) (Biclusters) via edges. This representation provides a quick overview of all genes, regulators and motifs for regulons. It also allows one to see shared genes/motifs/regulators among different regulons. Network representation is interactive. You can zoom in/out and move nodes/edges around. Clicking on a node will open up a window to give more details. The information shown for genes includes the locus tag, organism, genomic coordinates, NCBI gene ID, whether it is transcription factor and any associated functional information. For regulators, the number of regulons is shown in addition to gene details. For motifs, e-value, consensus sequence and sequence logo will be shown. For regulons, expression profile plot, motif information, functional associations and motif locations for each member of the regulon will be shown. You can pin information boxes by using the button in the box title and open up additional ones on the same screen for comparative analysis.
Regulation Tab
The regulation tab for each gene includes regulatory influences such as environmental factors or transcription factors or their combinations identified by regulatory network inference algorithms. If the gene is a member of a regulon, regulators influencing that regulon are also considered to regulate the gene. The regulators table lists the total number of regulatory influences, regulators, regulons and type of the influence. You can see a description of the regulator inside the tooltip when you mouseover. In certain cases the regulatory influence is predicted to be the result of the combination of two influences. These are indicated as a combiner in the column labeled "Operator". For transcription factors, an additional table next to regulator table will be shown. This table shows regulons that are influenced by the transcription factor.
Motifs Tab
Network inference algorithm uses de novo motif prediction for assigning genes to regulons. If there are any motifs identified in the upstream region of a gene, the motif will be shown here. For each motif sequence logo, consensus and e-value will be shown.
Functions Tab
Functional annotations for a given gene might be important to connect regulatory information with physiology of the cell. Therefore, functional annotations for each gene collected from KEGG, Gene Ontology (GO), Cluster of Orthologous Groups (COG) and TIGR Roles will be shown here. The function name is linked to its explanation and more details.
Regulon Members Tab
Identity of gene members in a regulon may help to identify potential interactions between different functional modules. Therefore, neighbor genes that share the same regulon(s) with gene under consideration are shown here. For each member, gene name, description and regulons that contain it are listed.
Help Tab
More general help can be accessed by clicking the help menu in the main navigation bar.
Social Tab
Network Portal is designed to promote collaboration through social interactions. Therefore, interested researchers can share information, questions and updates for a particular gene. Users can obtain login information by registering for our website. Alternatively, they can use their Facebook or Google accounts to connect to this page. Each regulon and gene page includes a comments tab that lists the history of interactions for that gene. You can browse the history, make updates, raise questions and share these activities within the social web. In future releases of the network portal, we are planning to create a personal space for each user that contains all the analysis steps performed by the user along with relevant information. It will be possible to share these personal spaces with other users.
CircVis
Our circular regulon explorer is adapted from visquick, which was originally developed by Dick Kreisberg of Ilya Shmulevich lab at ISB for The Cancer Genome Atlas. We use a simplified version of visquick to display distribution of regulon members and their interactions across the genome. This view provides summary of regulation information for a gene. The main components are;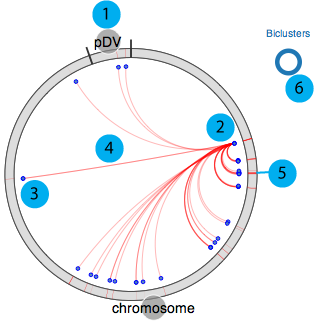
- 1. All genomic elements for the organism are represented as a circle and each element is separated by black tick marks. In this example "chromosome" and "pDV" represent the main chromosome and plasmid for D. vulgaris Hildenborough.
- 2. Source gene
- 3. Target genes (other regulon members)
- 4. Interactions between source and target genes for a particular regulon
- 5. Regulon(s) that the source gene and target genes belong to
- 6. Visualization legend
Navigating Module Pages
What is a module?
Regulatory units (modules) in the Network Portal are based on the network inference algorithm used. For the current version, modules are based on cMonkey modules and Inferelator regulatory influences on these modules. More specifically, module refers to set of genes that are conditionally co-regulated under subset of the conditions. Identification of modules integrates co-expression, de-novo motif identification, and other functional associations such as operon information and protein-protein interactions.
Module Overview
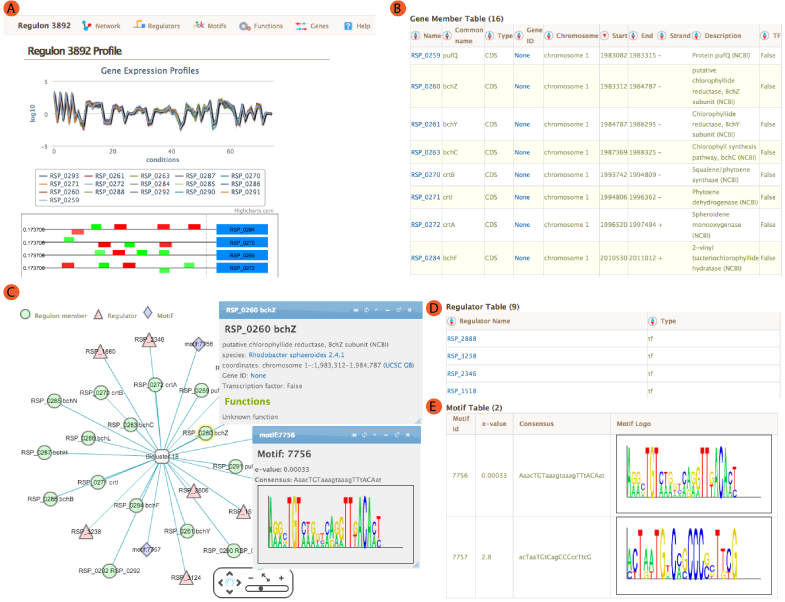
The landing module page shows quick summary info including co-expression profiles, de-novo identified motifs, and transcription factors and/or environmental factors as regulatory influences. It also includes module residual, motif e-values, conditions and links to other resources such as NCBI and Microbesonline. . If a transcription factor is included in the manually curated RegPrecise database, further information from RegPrecise is shown, allowing users to perform comparative analysis.
Expression Profiles
Expression profiles is a plot of the expression ratios (log10) of the module's genes, over all subset of the conditions included in the module. The X-axis represent conditions and the Y-axis represents log10 expression ratios. Each gene is plotted as line plot with different colors. Colored legend for the lines are presented under the plot. This plot is dynamic. Clicking on the gene names in the legend will show/hide the plot for that particular gene. A tooltip will show expression ratio information if you mouseover the lines in the plot.
Motif Locations
Location of the Identified motifs for the module in the upstream regions of the member genes are shown under the expression profiles plot. This plot shows the diagram of the upstream positions of the motifs, colored red and green for motifs #1, and 2, respectively. Intensity of the color is proportional to the significance of the occurence of that motif at a given location. Motifs on the forward and reverse strand are represented over and under the line respectively.
Network
A network view of the module is created using cytoscapeWeb and enables dynamic, interactive exploration of the module properties. In this view, module member genes, motifs, and regulatory influences are represented as peripheral nodes connected to core module node via edges. Module members are green circles, regulators are red triangles and motifs are blue diamonds. Selection of a node gives access to detailed information in a pop-up window, which allows dragging and pinning to compare multiple selections. Selecting module members will show information about the selected gene such as name, species and fucntions. Motif selection will show motif logo image and e-values. Bicluster selction will show expression profile and summary statistics for the module.
 Module member
  Regulator
  Motif
Motif
Regulators
For each module, single or AND logic connected regulatory influences are listed under the regulators tab. These regulatory influences are identified by Inferelator. Table shows name of the regulator and its type. tf: Transcription factor, ef: Environmental factor and combiner:Combinatorial influence of a tf or an ef through logic gate. Tabel is sortable by clicking on the arrows next to column headers.
Motifs
Transcription factor binding motifs help to elucidate regulatory mechanism. cMonkey integrates powerful de novo motif detection to identify conditionally co-regulated sets of genes. De novo predicted motifs for each module are listed in the module page as motif logo images along with associated prediction statistics (e-values). The main module page also shows the location of these motifs within the upstream sequences of the module member genes.
Motifs of interest can be broadcasted to RegPredict (currently only available for Desulfovibrio vulgaris Hildenborough) in order to compare conservation in similar species. This integrated motif prediction and comparative analysis provides an additional checkpoint for regulatory motif prediction confidence.
Functions
Biological networks contain sets of regulatory units called functional modules that together play a role in regulation of specific functional processes. Connections between different modules in the network can help identify regulatory relationships such as hierarchy and epistasis. In addition, associating functions with modules enables putative assignment of functions to hypothetical genes. It is therefore essential to identify functional enrichment of modules within the regulatory network.
Functional annotations from single sources are often either not available or not complete. Therefore, we integrated KEGG pathway, Gene Ontology, TIGRFam and COG information as references for functional enrichment analysis.
We use hypergeometric p-values to identify significant overlaps between co-regulated module members and genes assigned to a particular functional annotation category. P-values are corrected for multiple comparisons by using Benjamini-Hochberg correction and filtered for p-values ≤ 0.05.
Network Portal presents functional ontologies from KEGG, GO, TIGRFAM, and COG as separate tables that include function name, type, corrected and uncorrected hypergeometric p-values, and the number of genes assigned to this category out of total number of genes in the module.
Genes
Gene member table shows all the genes included in the module. Listed attributes are;
- Name: Gene name or Locus tag
- Common Name: Gene short name
- Type: Type of the feature, usually CDS.
- Gene ID: Link to NCBI Gene ID
- Chromosome: Chromosome name from annotation file
- Start/End:Feature start and end coordinates
- Strand: strand of the gene
- Description: Description of the gene from annotation file
- TF: If the gene is a Transcription Factor or not.
If you are browsing the Network Portal by using Gaggle/Firegoose, firegoose plugin will capture the NameList of the gene members. Captured names can be saved into your Workspace by clicking on "Capture" in the firegoose toolbar or can be directly sent other desktop and web resources by using "Broadcast" option.
Definitions
Residual: is a measure of bicluster quality. Mean bicluster residual is smaller when the expression profile of the genes in the module is "tighter". So smaller residuals are usually indicative of better bicluster quality.
Expression Profile: is a preview of the expression profiles of all the genes under subset of conditions included in the module. Tighter expression profiles are usually indicative of better bicluster quality.
Motif e-value: cMonkey tries to identify two motifs per modules in the upstream sequences of the module member genes. Motif e-value is an indicative of the motif co-occurences between the members of the module.Smaller e-values are indicative of significant sequence motifs. Our experience showed that e-values smaller than 10 are generally indicative of significant motifs.
Genes: Number of genes included in the module.
Functions: We identify functional enrichment of each module by camparing to different functional categories such as KEGG, COG, GO etc. by using hypergeometric function. If the module is significantly enriched for any of the functions, this column will list few of the these functions as an overview. Full list of functions is available upon visiting the module page under the Functions tab.
What is Gaggle?
Overview
The practice of systems biology depends upon many software tools, operating on many kinds of data from many different sources. Each of these tools typically excels at one (or a few) types of analysis with one (or a few) types of data. A crucial challenge, therefore, is to combine the capabilities of these and other, forthcoming tools to create a data exploration and analysis environment which can do justice to the variety and complexity of systems biology.
The Gaggle is a simple, open-source Java software environment which solves this problem. Guided by the classic software engineering strategy of separation of concerns and a policy of semantic flexibility, it combines existing popular programs and web resources into a user-friendly, rich, and easily extended environment in which to do systems biology.
We currently support a number of geese -- our name for any open source software which is adapted to run in the gaggle. This adaptation is generally only a small amount of programming work. Once gaggled the program can broadcast and receive any of a small number of data types which together constitute an adequate basis for exploratory analysis in systems biology. These data types include:
- Name list (i.e., these genes are interesting)
- Bicluster: Name list combined with a condition list (i.e., these genes are interesting in these conditions)
- Tuple (replaces HashMap): a collection of name/value pairs
- Matrix: rows and columns, each named, containing numerical data
- Network: a collection of nodes and edges, with arbitrary tuples associated with each
Current Geese
 The Boss acts as a hub that routes messages from one goose to another.
- Gaggle Boss Workflow Enabled
- Annotation. Search for functional annotations.
- Bioinformatics Resource Manager. A general purpose data management, analysis and integration environment for systems biology.
- Cytoscape. Network visualization. Workflow Enabled
- DMV. Datamatrix Viewer.
- Firegoose. Connect the Gaggle to the Web. Workflow Enabled
- Genome Browser. View data in genomic context.
- MatGoose. Exchange data between MatLab and the Gaggle.
- MeV. MultiExperiment Viewer. Cluster and visualize microarray data. Workflow Enabled
- R Goose. Exchange data between the R statistical environment and the Gaggle.
- Translator. Translate identifiers between naming systems or (by orthology) between organisms.
- Script Goose. A goose with an embedded HTTP server and command-line client, allowing programs written in any language to communicate with the Gaggle.
Gaggle is designed to make it easy to connect programs and databases with a minimum of effort. There are several third party Gaggle-connected applications.
Gaggle Development Principles
Core components
- The core components of the Gaggle are the Boss and the Goose interfaces. Because all Geese depend on these interfaces, changes to them require changes to all Geese. Therefore, changes to these interfaces must be carefully controlled to maintain compatibility.
- The Boss and Goose interfaces should be revised rarely and carefully.
- The right to change core components is reserved by the Baliga Lab at ISB.
- Feature requests for core components will be carefully considered.
Loose Coupling
- The Gaggle is designed as a system of loosely coupled components:
- Almost any desired functionality can be implemented as a Goose.
Data Types
- Existing Data types:
- name list
- tuple
- matrix
- network
- cluster
- A few general data types are preferred over special-purpose data types.
- Almost all biological data can be represented as one of the existing types.
- New data types should be introduced only when necessary.
Semantic Flexibility
- Since the Gaggle is a merely a conduit for transferring data between applications, it does not need to assign specific meaning or roles to the data.
- Interpreting the data is left up to the user and the applications.
Open Development
- The Gaggle is open source.
- The source repository for the core components of the Gaggle will be maintained at ISB.
- Permission to commit to the source repository will be granted on a case-by-case basis. Reading the source repository is open to all.
- Contributions of code, especially new Geese, are welcome.
The Gaggle Paper
These principles are more fully explained in the Gaggle paper.
Network Portal Screencasts
Discovering the regulation of target genesIn this screencast, we will explore the regulation of hemA gene in Rhodobacter sphaeroides. hemA and hemT genes encode isozymes that catalyze the formation of 5-aminolevulinic acid, the first step in the biosynthesis of all tetrapyrroles present in Rhodobacter spaheroides 2.4.1. |
Exploring gene function and regulation with WorkspaceIn this screencast, we will learn how to explore genes, co-regulated genes, and regulators within a gene regulatory network. Here, we will use network information to learn more about one poorly characterized gene. Our biological question is to explore cytochrome gene function in Geobacter sulfurreducens. G. sulfurreducens can receive electrons from other microbial species, which is useful in microbial fuel cells. Electron transfer involves c-type cytochromes. However, the specialization of the >100 c-type cytochromes in the genomes is only beginning to be described. |
Filtering regulatory modules to identify candidate co-regulatory modulesIn this use case we will browse and filter through the network modules table of Clostridium acetobutylicum in order to identify interesting pathways that display highly co-regulated structure. In this way, Network Portal can enable a user to quickly filter through the network and identify potential regulatory modules for subsequent in-depth investigations. |
Investigate regulation of specific metabolic pathways by using the search interface.In this use case we will make use of the search interface to identify regulatory information about chemotaxis-related processes in Methanococcus maripaludis S2. This exercise will allow us to query Network Portal for a specific keyword, find associated modules and drill down to various aspects of regulation. |
Identifying potential function for genes of “unknown function” by using guilt-by-association.This use case will seek potential new genes associated with carotenoid biosynthesis in R. sphaeroides 2.4.1 by investigating network modules enriched for genes involved in the carotenoid biosynthesis pathway. These potential functions will give you a starting point for more thorough analysis to discover the functions of hypothetical proteins. |
Using the Gaggle Firegoose toolbar to broadcast data from Network Portal to other web resources.In this use case we will go beyond the Network Portal by sending a list of genes that are included in a specific module to a web resource, EMBL String, to see what additional evidence indicates co-regulation for these genes. (Please note that Firegoose toolbar is currently only compatible with Firefox). The EMBL String functional association network strongly supports co-regulation of these genes by displaying a tightly integrated network that includes multiple different types of evidence |
For more screencasts visit our YouTube channel
Get Involved
Development
One of the key benefits of the Gaggle and Gaggle Workspace is that anyone can implement their own Geese. We hope to promote interoperability among bioinformatics applications by making this as easy as possible. Have an application you'd like to see included on this page? Please contact us by email (sturkars at systemsbiology.org) or through the discussion groups.
We strongly encourage developers to take advantage of easy implementation features in Gaggle and Network Portal. If you are a developer who would like to integrate his/her desktop/web applications with Gaggle/Network Portal we provide all the support you need.
Gaggle Subversion Repository
The Gaggle's source code is all open source, licensed under the LGPL, and served using the Subversion source code control system.
The current development branch of Gaggle is located in: http://gaggle.systemsbiology.net/svn/gaggle/gaggle/trunk
- To use the Subversion archive hosted at the Institute for Systems Biology,
take the following steps. (These instructions use unix-style commands; Windows
users translate accordingly.)
- Locate or install a Subversion client. (Below we use the command-line client, svn.)
-
mkdir yourInstallationDirectory -
svn checkout http://gaggle.systemsbiology.net/svn/gaggle/gaggle/trunk yourInstallationDirectory
- For authenticated access (allowing commits) to the Subversion archive, a password is required:
-
svn checkout --username username --password password http://gaggle.systemsbiology.net/svn/gaggle/gaggle/trunk yourInstallationDirectory
-
Firegoose Source code
- Firegoose source is here: http://gaggle.systemsbiology.net/svn/gaggle/FireGoose/trunk/
Network Portal Source code
- Network Portal source is here: https://github.com/baliga-lab/network_portal
Gaggle Workspace API
- Workspace API documentation is here: API Documents
Social
You can start a conversation about this module or join the existing discussion by adding your comments. In order to be able to add your comments you need to sign in by using any of the following services;Disqus, Google, Facebook or Twitter. For full compatibility with other network portal features, we recommend using your Google ID.