Hierarchical Clusters
Displaying 6101 - 6200 of 7500
| Title | Cluster Plot | Dendrogram | e-value | e-value | e-value | Condition | Condition FDR | Condition Difference |
|---|---|---|---|---|---|---|---|---|
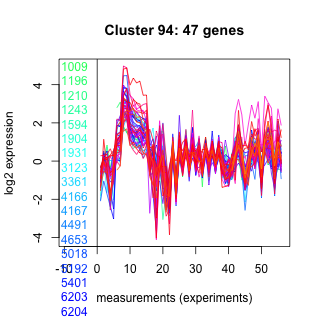
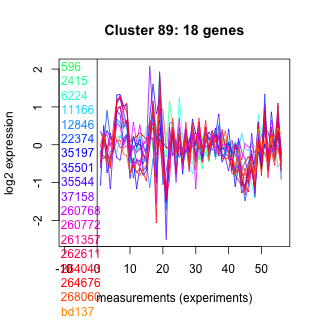
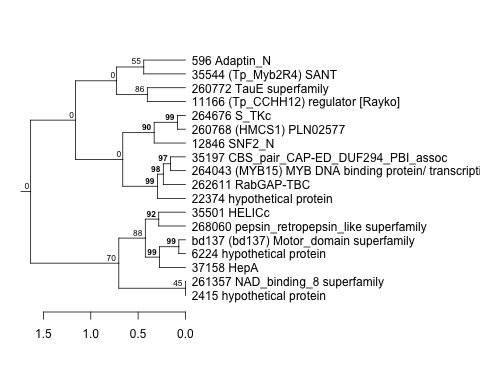
| Thaps_hclust_0094 |
 |
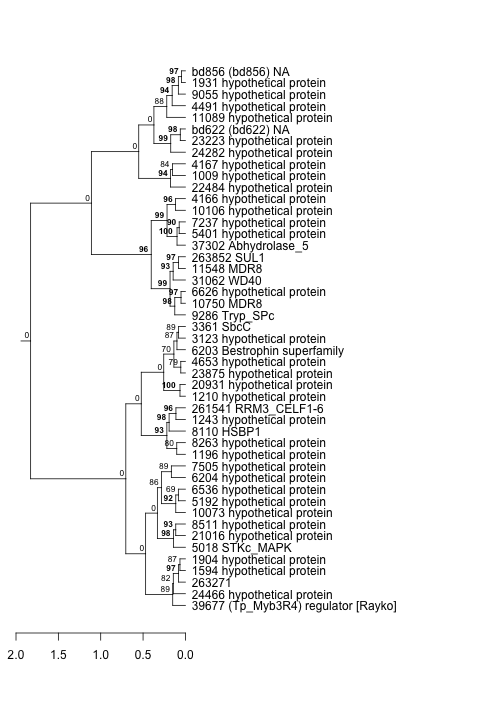 |
0.0000000025 |
0.000014 |
0.0000045 |
BaP | 0.000370 | -0.531 |
| Thaps_hclust_0094 |
|
|
0.0000000025 |
0.000014 |
0.0000045 |
exponential_vs_stationary_24highlight | 0.857000 | -0.0159 |
| Thaps_hclust_0094 |
|
|
0.0000000025 |
0.000014 |
0.0000045 |
co2_elevated_stat_arrays | 0.000658 | 0.663 |
| Thaps_hclust_0094 |
|
|
0.0000000025 |
0.000014 |
0.0000045 |
lowtemp_TMEVA | 0.002670 | -0.448 |
| Thaps_hclust_0094 |
|
|
0.0000000025 |
0.000014 |
0.0000045 |
highpH_TMEVA | 0.000725 | -0.883 |
| Title | Cluster Plot | Dendrogram | e-value | e-value | e-value | Condition | Condition FDR | Condition Difference |
|---|---|---|---|---|---|---|---|---|
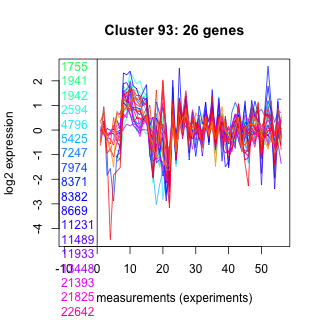
| Thaps_hclust_0093 |
 |
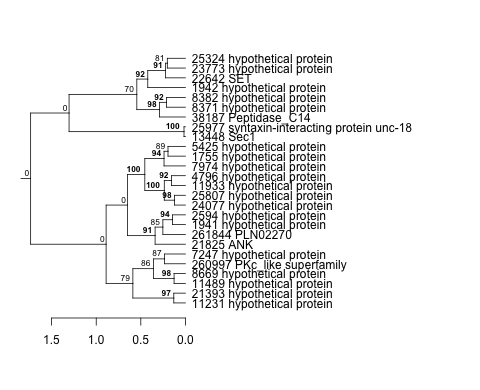 |
0.0000082 |
0.022 |
0.0012 |
highpH_TMEVA | 0.466000 | -0.114 |
| Thaps_hclust_0093 |
|
|
0.0000082 |
0.022 |
0.0012 |
co2_elevated_expo_arrays | 0.361000 | 0.154 |
| Thaps_hclust_0093 |
|
|
0.0000082 |
0.022 |
0.0012 |
lowFe_TMEVA | 0.304000 | 0.259 |
| Thaps_hclust_0093 |
|
|
0.0000082 |
0.022 |
0.0012 |
exponential_vs_stationary_24light | 0.118000 | 0.434 |
| Thaps_hclust_0093 |
|
|
0.0000082 |
0.022 |
0.0012 |
lowN_TMEVA | 0.077300 | -0.5 |
| Thaps_hclust_0093 |
|
|
0.0000082 |
0.022 |
0.0012 |
diel_exponential_vs_stationary | 0.378000 | -0.15 |
| Thaps_hclust_0093 |
|
|
0.0000082 |
0.022 |
0.0012 |
lowSi_TMEVA | 0.014200 | -0.812 |
| Thaps_hclust_0093 |
|
|
0.0000082 |
0.022 |
0.0012 |
highlight_arrays | 0.939000 | -0.0145 |
| Thaps_hclust_0093 |
|
|
0.0000082 |
0.022 |
0.0012 |
diel_light_vs_dark | 0.000485 | 0.897 |
| Thaps_hclust_0093 |
|
|
0.0000082 |
0.022 |
0.0012 |
lowFe_KTKB_Day3 | 0.572000 | -0.136 |
| Thaps_hclust_0093 |
|
|
0.0000082 |
0.022 |
0.0012 |
lowFe_KTKB_Day5 | 0.001320 | -0.741 |
| Thaps_hclust_0093 |
|
|
0.0000082 |
0.022 |
0.0012 |
BaP | 0.001030 | -0.619 |
| Thaps_hclust_0093 |
|
|
0.0000082 |
0.022 |
0.0012 |
exponential_vs_stationary_24highlight | 0.014100 | 0.22 |
| Thaps_hclust_0093 |
|
|
0.0000082 |
0.022 |
0.0012 |
co2_elevated_stat_arrays | 0.006310 | 0.48 |
| Thaps_hclust_0093 |
|
|
0.0000082 |
0.022 |
0.0012 |
lowtemp_TMEVA | 0.006170 | -0.658 |
| Title | Cluster Plot | Dendrogram | e-value | e-value | e-value | Condition | Condition FDR | Condition Difference |
|---|---|---|---|---|---|---|---|---|
| Thaps_hclust_0092 |
 |
|
1.3e-37 |
4.2e-20 |
0.0000000000000013 |
lowtemp_TMEVA | 0.038100 | -0.246 |
| Thaps_hclust_0092 |
|
|
1.3e-37 |
4.2e-20 |
0.0000000000000013 |
highpH_TMEVA | 0.000725 | -0.895 |
| Thaps_hclust_0092 |
|
|
1.3e-37 |
4.2e-20 |
0.0000000000000013 |
co2_elevated_expo_arrays | 0.001390 | 1.11 |
| Thaps_hclust_0092 |
|
|
1.3e-37 |
4.2e-20 |
0.0000000000000013 |
lowFe_TMEVA | 0.766000 | 0.0993 |
| Thaps_hclust_0092 |
|
|
1.3e-37 |
4.2e-20 |
0.0000000000000013 |
exponential_vs_stationary_24light | 0.000581 | 1.99 |
| Thaps_hclust_0092 |
|
|
1.3e-37 |
4.2e-20 |
0.0000000000000013 |
lowN_TMEVA | 0.001190 | -0.464 |
| Thaps_hclust_0092 |
|
|
1.3e-37 |
4.2e-20 |
0.0000000000000013 |
diel_exponential_vs_stationary | 0.043600 | 0.159 |
| Thaps_hclust_0092 |
|
|
1.3e-37 |
4.2e-20 |
0.0000000000000013 |
lowSi_TMEVA | 0.001350 | -1.05 |
| Thaps_hclust_0092 |
|
|
1.3e-37 |
4.2e-20 |
0.0000000000000013 |
highlight_arrays | 0.000442 | -0.346 |
| Thaps_hclust_0092 |
|
|
1.3e-37 |
4.2e-20 |
0.0000000000000013 |
diel_light_vs_dark | 0.000485 | 1.49 |
| Thaps_hclust_0092 |
|
|
1.3e-37 |
4.2e-20 |
0.0000000000000013 |
lowFe_KTKB_Day3 | 0.000862 | 0.577 |
| Thaps_hclust_0092 |
|
|
1.3e-37 |
4.2e-20 |
0.0000000000000013 |
lowFe_KTKB_Day5 | 0.001320 | 0.343 |
| Thaps_hclust_0092 |
|
|
1.3e-37 |
4.2e-20 |
0.0000000000000013 |
BaP | 0.537000 | -0.0686 |
| Thaps_hclust_0092 |
|
|
1.3e-37 |
4.2e-20 |
0.0000000000000013 |
exponential_vs_stationary_24highlight | 0.722000 | -0.0199 |
| Thaps_hclust_0092 |
|
|
1.3e-37 |
4.2e-20 |
0.0000000000000013 |
co2_elevated_stat_arrays | 0.000658 | 1.24 |
| Title | Cluster Plot | Dendrogram | e-value | e-value | e-value | Condition | Condition FDR | Condition Difference |
|---|---|---|---|---|---|---|---|---|
| Thaps_hclust_0091 |
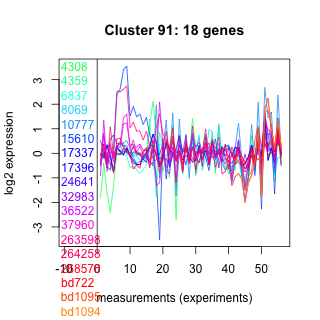 |
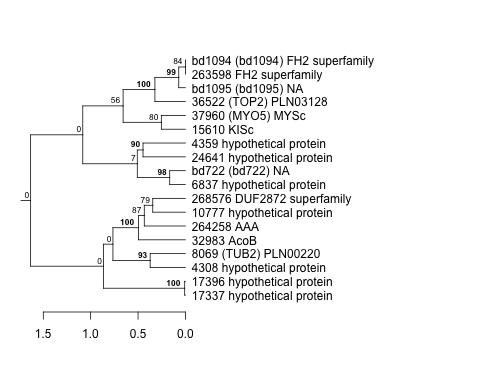 |
0.00000061 |
0.00022 |
0.44 |
co2_elevated_stat_arrays | 0.066800 | 0.416 |
| Thaps_hclust_0091 |
|
|
0.00000061 |
0.00022 |
0.44 |
lowtemp_TMEVA | 0.384000 | -0.24 |
| Thaps_hclust_0091 |
|
|
0.00000061 |
0.00022 |
0.44 |
highpH_TMEVA | 0.026800 | -0.373 |
| Thaps_hclust_0091 |
|
|
0.00000061 |
0.00022 |
0.44 |
co2_elevated_expo_arrays | 0.001390 | 0.65 |
| Thaps_hclust_0091 |
|
|
0.00000061 |
0.00022 |
0.44 |
lowFe_TMEVA | 0.464000 | 0.214 |
| Thaps_hclust_0091 |
|
|
0.00000061 |
0.00022 |
0.44 |
exponential_vs_stationary_24light | 0.001120 | 1.03 |
| Thaps_hclust_0091 |
|
|
0.00000061 |
0.00022 |
0.44 |
lowN_TMEVA | 0.349000 | -0.33 |
| Thaps_hclust_0091 |
|
|
0.00000061 |
0.00022 |
0.44 |
diel_exponential_vs_stationary | 0.916000 | -0.0255 |
| Thaps_hclust_0091 |
|
|
0.00000061 |
0.00022 |
0.44 |
lowSi_TMEVA | 0.976000 | -0.124 |
| Thaps_hclust_0091 |
|
|
0.00000061 |
0.00022 |
0.44 |
highlight_arrays | 0.000442 | -0.763 |
| Thaps_hclust_0091 |
|
|
0.00000061 |
0.00022 |
0.44 |
diel_light_vs_dark | 0.012700 | 0.524 |
| Thaps_hclust_0091 |
|
|
0.00000061 |
0.00022 |
0.44 |
lowFe_KTKB_Day3 | 0.581000 | 0.158 |
| Thaps_hclust_0091 |
|
|
0.00000061 |
0.00022 |
0.44 |
lowFe_KTKB_Day5 | 0.179000 | 0.282 |
| Thaps_hclust_0091 |
|
|
0.00000061 |
0.00022 |
0.44 |
BaP | 0.954000 | -0.0171 |
| Thaps_hclust_0091 |
|
|
0.00000061 |
0.00022 |
0.44 |
exponential_vs_stationary_24highlight | 0.279000 | 0.125 |
| Title | Cluster Plot | Dendrogram | e-value | e-value | e-value | Condition | Condition FDR | Condition Difference |
|---|---|---|---|---|---|---|---|---|
| Thaps_hclust_0090 |
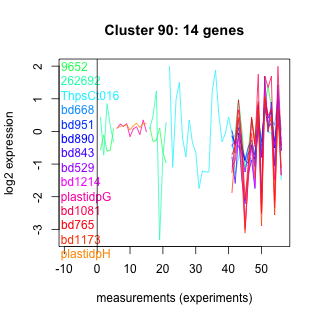 |
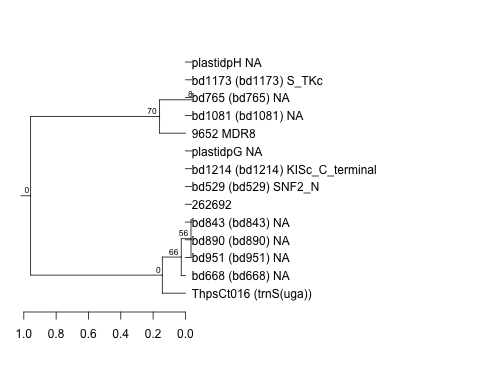 |
0.23 |
2.7 |
11 |
exponential_vs_stationary_24highlight | 0.187000 | 0.168 |
| Thaps_hclust_0090 |
|
|
0.23 |
2.7 |
11 |
co2_elevated_stat_arrays | 0.022900 | 0.56 |
| Thaps_hclust_0090 |
|
|
0.23 |
2.7 |
11 |
lowtemp_TMEVA | 0.701000 | -0.123 |
| Thaps_hclust_0090 |
|
|
0.23 |
2.7 |
11 |
highpH_TMEVA | 0.771000 | -0.0666 |
| Thaps_hclust_0090 |
|
|
0.23 |
2.7 |
11 |
co2_elevated_expo_arrays | 0.001390 | 0.773 |
| Thaps_hclust_0090 |
|
|
0.23 |
2.7 |
11 |
lowFe_TMEVA | 0.181000 | -0.416 |
| Thaps_hclust_0090 |
|
|
0.23 |
2.7 |
11 |
exponential_vs_stationary_24light | 0.000581 | 1.5 |
| Thaps_hclust_0090 |
|
|
0.23 |
2.7 |
11 |
lowN_TMEVA | 0.761000 | 0.122 |
| Thaps_hclust_0090 |
|
|
0.23 |
2.7 |
11 |
diel_exponential_vs_stationary | 0.010500 | 0.541 |
| Thaps_hclust_0090 |
|
|
0.23 |
2.7 |
11 |
lowSi_TMEVA | 0.861000 | -0.201 |
| Thaps_hclust_0090 |
|
|
0.23 |
2.7 |
11 |
highlight_arrays | 0.000442 | -0.761 |
| Thaps_hclust_0090 |
|
|
0.23 |
2.7 |
11 |
diel_light_vs_dark | 0.070600 | -0.424 |
| Thaps_hclust_0090 |
|
|
0.23 |
2.7 |
11 |
lowFe_KTKB_Day3 | 0.746000 | 0.112 |
| Thaps_hclust_0090 |
|
|
0.23 |
2.7 |
11 |
lowFe_KTKB_Day5 | 0.760000 | 0.0836 |
| Thaps_hclust_0090 |
|
|
0.23 |
2.7 |
11 |
BaP | 0.031100 | -0.539 |
| Title | Cluster Plot | Dendrogram | e-value | e-value | e-value | Condition | Condition FDR | Condition Difference |
|---|---|---|---|---|---|---|---|---|
| Thaps_hclust_0089 |
 |
 |
0.000036 |
0.00054 |
0.075 |
BaP | 0.483000 | -0.174 |
| Thaps_hclust_0089 |
|
|
0.000036 |
0.00054 |
0.075 |
exponential_vs_stationary_24highlight | 0.034900 | 0.233 |
| Thaps_hclust_0089 |
|
|
0.000036 |
0.00054 |
0.075 |
co2_elevated_stat_arrays | 0.444000 | -0.195 |
| Thaps_hclust_0089 |
|
|
0.000036 |
0.00054 |
0.075 |
lowtemp_TMEVA | 0.825000 | 0.0683 |
| Thaps_hclust_0089 |
|
|
0.000036 |
0.00054 |
0.075 |
highpH_TMEVA | 0.053300 | -0.321 |
| Thaps_hclust_0089 |
|
|
0.000036 |
0.00054 |
0.075 |
co2_elevated_expo_arrays | 0.224000 | 0.201 |
| Thaps_hclust_0089 |
|
|
0.000036 |
0.00054 |
0.075 |
lowFe_TMEVA | 0.813000 | 0.0953 |
| Thaps_hclust_0089 |
|
|
0.000036 |
0.00054 |
0.075 |
exponential_vs_stationary_24light | 0.064800 | 0.596 |
| Thaps_hclust_0089 |
|
|
0.000036 |
0.00054 |
0.075 |
lowN_TMEVA | 0.741000 | -0.133 |
| Thaps_hclust_0089 |
|
|
0.000036 |
0.00054 |
0.075 |
diel_exponential_vs_stationary | 0.896000 | 0.0326 |
| Thaps_hclust_0089 |
|
|
0.000036 |
0.00054 |
0.075 |
lowSi_TMEVA | 0.838000 | -0.227 |
| Thaps_hclust_0089 |
|
|
0.000036 |
0.00054 |
0.075 |
highlight_arrays | 0.000442 | -0.573 |
| Thaps_hclust_0089 |
|
|
0.000036 |
0.00054 |
0.075 |
diel_light_vs_dark | 0.136000 | 0.321 |
| Thaps_hclust_0089 |
|
|
0.000036 |
0.00054 |
0.075 |
lowFe_KTKB_Day3 | 0.165000 | 0.339 |
| Thaps_hclust_0089 |
|
|
0.000036 |
0.00054 |
0.075 |
lowFe_KTKB_Day5 | 0.002440 | 0.622 |
| Title | Cluster Plot | Dendrogram | e-value | e-value | e-value | Condition | Condition FDR | Condition Difference |
|---|---|---|---|---|---|---|---|---|
| Thaps_hclust_0088 |
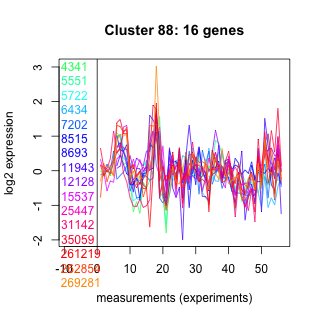 |
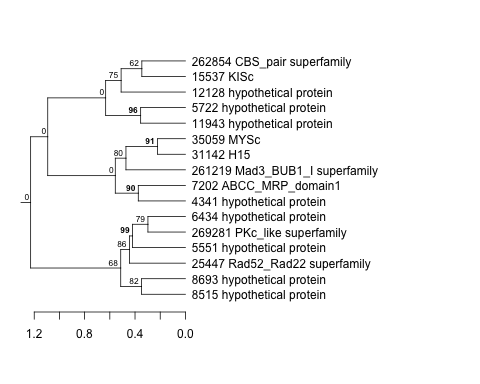 |
0.036 |
27 |
18 |
lowFe_KTKB_Day5 | 0.005100 | 0.648 |
| Thaps_hclust_0088 |
|
|
0.036 |
27 |
18 |
BaP | 0.600000 | 0.141 |
| Thaps_hclust_0088 |
|
|
0.036 |
27 |
18 |
exponential_vs_stationary_24highlight | 0.132000 | 0.178 |
| Thaps_hclust_0088 |
|
|
0.036 |
27 |
18 |
co2_elevated_stat_arrays | 0.706000 | 0.107 |
| Thaps_hclust_0088 |
|
|
0.036 |
27 |
18 |
lowtemp_TMEVA | 0.385000 | 0.252 |
| Thaps_hclust_0088 |
|
|
0.036 |
27 |
18 |
highpH_TMEVA | 0.964000 | 0.0162 |
| Thaps_hclust_0088 |
|
|
0.036 |
27 |
18 |
co2_elevated_expo_arrays | 0.047900 | 0.295 |
| Thaps_hclust_0088 |
|
|
0.036 |
27 |
18 |
lowFe_TMEVA | 0.974000 | 0.0215 |
| Thaps_hclust_0088 |
|
|
0.036 |
27 |
18 |
exponential_vs_stationary_24light | 0.189000 | 0.455 |
| Thaps_hclust_0088 |
|
|
0.036 |
27 |
18 |
lowN_TMEVA | 0.861000 | -0.0633 |
| Thaps_hclust_0088 |
|
|
0.036 |
27 |
18 |
diel_exponential_vs_stationary | 0.533000 | -0.141 |
| Thaps_hclust_0088 |
|
|
0.036 |
27 |
18 |
lowSi_TMEVA | 1.000000 | 0.00955 |
| Thaps_hclust_0088 |
|
|
0.036 |
27 |
18 |
highlight_arrays | 0.003170 | -0.513 |
| Thaps_hclust_0088 |
|
|
0.036 |
27 |
18 |
diel_light_vs_dark | 0.577000 | 0.153 |
| Thaps_hclust_0088 |
|
|
0.036 |
27 |
18 |
lowFe_KTKB_Day3 | 0.357000 | 0.257 |
| Title | Cluster Plot | Dendrogram | e-value | e-value | e-value | Condition | Condition FDR | Condition Difference |
|---|---|---|---|---|---|---|---|---|
| Thaps_hclust_0087 |
 |
 |
0.00000000000011 |
0.000026 |
0.028 |
lowFe_KTKB_Day5 | 0.496000 | -0.119 |
| Thaps_hclust_0087 |
|
|
0.00000000000011 |
0.000026 |
0.028 |
BaP | 0.073200 | -0.295 |
| Thaps_hclust_0087 |
|
|
0.00000000000011 |
0.000026 |
0.028 |
exponential_vs_stationary_24highlight | 0.554000 | 0.0557 |
| Thaps_hclust_0087 |
|
|
0.00000000000011 |
0.000026 |
0.028 |
co2_elevated_stat_arrays | 0.801000 | -0.07 |
| Thaps_hclust_0087 |
|
|
0.00000000000011 |
0.000026 |
0.028 |
lowtemp_TMEVA | 0.063900 | 0.372 |