Hierarchical Clusters
Displaying 6401 - 6500 of 7500
| Title | Cluster Plot | Dendrogram | e-value | e-value | e-value | Condition | Condition FDR | Condition Difference |
|---|---|---|---|---|---|---|---|---|
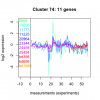
| Thaps_hclust_0074 |
 |
 |
77 |
130 |
300 |
lowtemp_TMEVA | 0.784000 | -0.103 |
| Thaps_hclust_0074 |
 |
 |
77 |
130 |
300 |
highpH_TMEVA | 0.909000 | -0.0355 |
| Thaps_hclust_0074 |
 |
 |
77 |
130 |
300 |
co2_elevated_expo_arrays | 0.943000 | -0.0406 |
| Thaps_hclust_0074 |
 |
 |
77 |
130 |
300 |
lowFe_TMEVA | 0.427000 | -0.271 |
| Thaps_hclust_0074 |
 |
 |
77 |
130 |
300 |
exponential_vs_stationary_24light | 0.482000 | 0.306 |
| Title | Cluster Plot | Dendrogram | e-value | e-value | e-value | Condition | Condition FDR | Condition Difference |
|---|---|---|---|---|---|---|---|---|
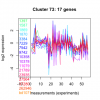
| Thaps_hclust_0073 |
 |
 |
0.013 |
0.043 |
210 |
exponential_vs_stationary_24light | 0.000581 | 1.35 |
| Thaps_hclust_0073 |
 |
 |
0.013 |
0.043 |
210 |
lowN_TMEVA | 0.038000 | -0.701 |
| Thaps_hclust_0073 |
 |
 |
0.013 |
0.043 |
210 |
diel_exponential_vs_stationary | 0.096400 | 0.319 |
| Thaps_hclust_0073 |
 |
 |
0.013 |
0.043 |
210 |
lowSi_TMEVA | 0.164000 | -0.646 |
| Thaps_hclust_0073 |
 |
 |
0.013 |
0.043 |
210 |
highlight_arrays | 0.000442 | -0.656 |
| Thaps_hclust_0073 |
 |
 |
0.013 |
0.043 |
210 |
diel_light_vs_dark | 0.000485 | -1.09 |
| Thaps_hclust_0073 |
 |
 |
0.013 |
0.043 |
210 |
lowFe_KTKB_Day3 | 0.319000 | -0.264 |
| Thaps_hclust_0073 |
 |
 |
0.013 |
0.043 |
210 |
lowFe_KTKB_Day5 | 0.808000 | -0.0611 |
| Thaps_hclust_0073 |
 |
 |
0.013 |
0.043 |
210 |
BaP | 0.000370 | -1.3 |
| Thaps_hclust_0073 |
 |
 |
0.013 |
0.043 |
210 |
exponential_vs_stationary_24highlight | 0.000926 | 0.368 |
| Thaps_hclust_0073 |
 |
 |
0.013 |
0.043 |
210 |
co2_elevated_stat_arrays | 0.574000 | 0.151 |
| Thaps_hclust_0073 |
 |
 |
0.013 |
0.043 |
210 |
lowtemp_TMEVA | 0.000735 | 1.09 |
| Thaps_hclust_0073 |
 |
 |
0.013 |
0.043 |
210 |
highpH_TMEVA | 0.000725 | -0.642 |
| Thaps_hclust_0073 |
 |
 |
0.013 |
0.043 |
210 |
co2_elevated_expo_arrays | 0.016400 | 0.333 |
| Thaps_hclust_0073 |
 |
 |
0.013 |
0.043 |
210 |
lowFe_TMEVA | 0.001040 | -0.77 |
| Title | Cluster Plot | Dendrogram | e-value | e-value | e-value | Condition | Condition FDR | Condition Difference |
|---|---|---|---|---|---|---|---|---|
| Thaps_hclust_0072 |
 |
 |
1.2e-22 |
1.1e-16 |
0.000000000000011 |
lowFe_TMEVA | 0.899000 | -0.0587 |
| Thaps_hclust_0072 |
 |
 |
1.2e-22 |
1.1e-16 |
0.000000000000011 |
exponential_vs_stationary_24light | 0.547000 | 0.307 |
| Thaps_hclust_0072 |
 |
 |
1.2e-22 |
1.1e-16 |
0.000000000000011 |
lowN_TMEVA | 0.120000 | 0.766 |
| Thaps_hclust_0072 |
 |
 |
1.2e-22 |
1.1e-16 |
0.000000000000011 |
diel_exponential_vs_stationary | 0.079000 | 0.513 |
| Thaps_hclust_0072 |
 |
 |
1.2e-22 |
1.1e-16 |
0.000000000000011 |
lowSi_TMEVA | 0.051200 | -1.14 |
| Thaps_hclust_0072 |
 |
 |
1.2e-22 |
1.1e-16 |
0.000000000000011 |
highlight_arrays | 0.502000 | -0.173 |
| Thaps_hclust_0072 |
 |
 |
1.2e-22 |
1.1e-16 |
0.000000000000011 |
diel_light_vs_dark | 0.629000 | -0.188 |
| Thaps_hclust_0072 |
 |
 |
1.2e-22 |
1.1e-16 |
0.000000000000011 |
lowFe_KTKB_Day3 | 0.157000 | -0.534 |
| Thaps_hclust_0072 |
 |
 |
1.2e-22 |
1.1e-16 |
0.000000000000011 |
lowFe_KTKB_Day5 | 0.501000 | -0.218 |
| Thaps_hclust_0072 |
 |
 |
1.2e-22 |
1.1e-16 |
0.000000000000011 |
BaP | 0.284000 | -0.374 |
| Thaps_hclust_0072 |
 |
 |
1.2e-22 |
1.1e-16 |
0.000000000000011 |
exponential_vs_stationary_24highlight | 0.035600 | 0.354 |
| Thaps_hclust_0072 |
 |
 |
1.2e-22 |
1.1e-16 |
0.000000000000011 |
co2_elevated_stat_arrays | 0.848000 | -0.0679 |
| Thaps_hclust_0072 |
 |
 |
1.2e-22 |
1.1e-16 |
0.000000000000011 |
lowtemp_TMEVA | 0.044600 | 0.856 |
| Thaps_hclust_0072 |
 |
 |
1.2e-22 |
1.1e-16 |
0.000000000000011 |
highpH_TMEVA | 0.131000 | 0.364 |
| Thaps_hclust_0072 |
 |
 |
1.2e-22 |
1.1e-16 |
0.000000000000011 |
co2_elevated_expo_arrays | 0.943000 | -0.0434 |
| Title | Cluster Plot | Dendrogram | e-value | e-value | e-value | Condition | Condition FDR | Condition Difference |
|---|---|---|---|---|---|---|---|---|
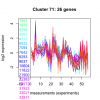
| Thaps_hclust_0071 |
 |
 |
0.0000019 |
0.0000028 |
0.00008 |
co2_elevated_expo_arrays | 0.002630 | 0.349 |
| Thaps_hclust_0071 |
 |
 |
0.0000019 |
0.0000028 |
0.00008 |
lowFe_TMEVA | 0.337000 | -0.244 |
| Thaps_hclust_0071 |
 |
 |
0.0000019 |
0.0000028 |
0.00008 |
exponential_vs_stationary_24light | 0.000581 | 1.88 |
| Thaps_hclust_0071 |
 |
 |
0.0000019 |
0.0000028 |
0.00008 |
lowN_TMEVA | 0.031600 | -0.601 |
| Thaps_hclust_0071 |
 |
 |
0.0000019 |
0.0000028 |
0.00008 |
diel_exponential_vs_stationary | 0.000602 | 0.995 |
| Thaps_hclust_0071 |
 |
 |
0.0000019 |
0.0000028 |
0.00008 |
lowSi_TMEVA | 0.557000 | -0.349 |
| Thaps_hclust_0071 |
 |
 |
0.0000019 |
0.0000028 |
0.00008 |
highlight_arrays | 0.000442 | -0.66 |
| Thaps_hclust_0071 |
 |
 |
0.0000019 |
0.0000028 |
0.00008 |
diel_light_vs_dark | 0.000485 | -0.596 |
| Thaps_hclust_0071 |
 |
 |
0.0000019 |
0.0000028 |
0.00008 |
lowFe_KTKB_Day3 | 0.369000 | 0.196 |
| Thaps_hclust_0071 |
 |
 |
0.0000019 |
0.0000028 |
0.00008 |
lowFe_KTKB_Day5 | 0.605000 | -0.101 |
| Thaps_hclust_0071 |
 |
 |
0.0000019 |
0.0000028 |
0.00008 |
BaP | 0.034800 | -0.394 |
| Thaps_hclust_0071 |
 |
 |
0.0000019 |
0.0000028 |
0.00008 |
exponential_vs_stationary_24highlight | 0.000526 | 0.319 |
| Thaps_hclust_0071 |
 |
 |
0.0000019 |
0.0000028 |
0.00008 |
co2_elevated_stat_arrays | 0.503000 | 0.159 |
| Thaps_hclust_0071 |
 |
 |
0.0000019 |
0.0000028 |
0.00008 |
lowtemp_TMEVA | 0.000735 | 2.35 |
| Thaps_hclust_0071 |
 |
 |
0.0000019 |
0.0000028 |
0.00008 |
highpH_TMEVA | 0.492000 | -0.107 |
| Title | Cluster Plot | Dendrogram | e-value | e-value | e-value | Condition | Condition FDR | Condition Difference |
|---|---|---|---|---|---|---|---|---|
| Thaps_hclust_0070 |
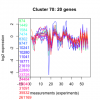 |
 |
0.00015 |
0.0025 |
0.041 |
highpH_TMEVA | 0.644000 | -0.0859 |
| Thaps_hclust_0070 |
 |
 |
0.00015 |
0.0025 |
0.041 |
co2_elevated_expo_arrays | 0.833000 | 0.0704 |
| Thaps_hclust_0070 |
 |
 |
0.00015 |
0.0025 |
0.041 |
lowFe_TMEVA | 0.108000 | -0.412 |
| Thaps_hclust_0070 |
 |
 |
0.00015 |
0.0025 |
0.041 |
exponential_vs_stationary_24light | 0.000581 | 1.75 |
| Thaps_hclust_0070 |
 |
 |
0.00015 |
0.0025 |
0.041 |
lowN_TMEVA | 0.003130 | -0.919 |
| Thaps_hclust_0070 |
 |
 |
0.00015 |
0.0025 |
0.041 |
diel_exponential_vs_stationary | 0.000602 | 1.01 |
| Thaps_hclust_0070 |
 |
 |
0.00015 |
0.0025 |
0.041 |
lowSi_TMEVA | 0.036700 | -0.797 |
| Thaps_hclust_0070 |
 |
 |
0.00015 |
0.0025 |
0.041 |
highlight_arrays | 0.000442 | -0.572 |
| Thaps_hclust_0070 |
 |
 |
0.00015 |
0.0025 |
0.041 |
diel_light_vs_dark | 0.636000 | -0.12 |
| Thaps_hclust_0070 |
 |
 |
0.00015 |
0.0025 |
0.041 |
lowFe_KTKB_Day3 | 0.296000 | 0.252 |
| Thaps_hclust_0070 |
 |
 |
0.00015 |
0.0025 |
0.041 |
lowFe_KTKB_Day5 | 0.637000 | -0.104 |
| Thaps_hclust_0070 |
 |
 |
0.00015 |
0.0025 |
0.041 |
BaP | 0.000370 | -1.07 |
| Thaps_hclust_0070 |
 |
 |
0.00015 |
0.0025 |
0.041 |
exponential_vs_stationary_24highlight | 0.000526 | 0.547 |
| Thaps_hclust_0070 |
 |
 |
0.00015 |
0.0025 |
0.041 |
co2_elevated_stat_arrays | 0.910000 | 0.0336 |
| Thaps_hclust_0070 |
 |
 |
0.00015 |
0.0025 |
0.041 |
lowtemp_TMEVA | 0.441000 | -0.199 |
| Title | Cluster Plot | Dendrogram | e-value | e-value | e-value | Condition | Condition FDR | Condition Difference |
|---|---|---|---|---|---|---|---|---|
| Thaps_hclust_0069 |
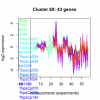 |
 |
1.2e-26 |
2.6e-24 |
2.4e-20 |
lowtemp_TMEVA | 0.041200 | -0.347 |
| Thaps_hclust_0069 |
 |
 |
1.2e-26 |
2.6e-24 |
2.4e-20 |
highpH_TMEVA | 0.000725 | -0.819 |
| Thaps_hclust_0069 |
 |
 |
1.2e-26 |
2.6e-24 |
2.4e-20 |
co2_elevated_expo_arrays | 0.660000 | 0.0935 |
| Thaps_hclust_0069 |
 |
 |
1.2e-26 |
2.6e-24 |
2.4e-20 |
lowFe_TMEVA | 0.001040 | -0.729 |
| Thaps_hclust_0069 |
 |
 |
1.2e-26 |
2.6e-24 |
2.4e-20 |
exponential_vs_stationary_24light | 0.000581 | 2.1 |
| Thaps_hclust_0069 |
 |
 |
1.2e-26 |
2.6e-24 |
2.4e-20 |
lowN_TMEVA | 0.004000 | -0.621 |
| Thaps_hclust_0069 |
 |
 |
1.2e-26 |
2.6e-24 |
2.4e-20 |
diel_exponential_vs_stationary | 0.000602 | 1.82 |
| Thaps_hclust_0069 |
 |
 |
1.2e-26 |
2.6e-24 |
2.4e-20 |
lowSi_TMEVA | 0.296000 | -0.408 |
| Thaps_hclust_0069 |
 |
 |
1.2e-26 |
2.6e-24 |
2.4e-20 |
highlight_arrays | 0.000442 | -1.38 |
| Thaps_hclust_0069 |
 |
 |
1.2e-26 |
2.6e-24 |
2.4e-20 |
diel_light_vs_dark | 0.004510 | -0.384 |
| Thaps_hclust_0069 |
 |
 |
1.2e-26 |
2.6e-24 |
2.4e-20 |
lowFe_KTKB_Day3 | 0.463000 | -0.129 |
| Thaps_hclust_0069 |
 |
 |
1.2e-26 |
2.6e-24 |
2.4e-20 |
lowFe_KTKB_Day5 | 0.059800 | -0.251 |
| Thaps_hclust_0069 |
 |
 |
1.2e-26 |
2.6e-24 |
2.4e-20 |
BaP | 0.492000 | -0.111 |
| Thaps_hclust_0069 |
 |
 |
1.2e-26 |
2.6e-24 |
2.4e-20 |
exponential_vs_stationary_24highlight | 0.000526 | 0.306 |
| Thaps_hclust_0069 |
 |
 |
1.2e-26 |
2.6e-24 |
2.4e-20 |
co2_elevated_stat_arrays | 0.000658 | 0.711 |
| Title | Cluster Plot | Dendrogram | e-value | e-value | e-value | Condition | Condition FDR | Condition Difference |
|---|---|---|---|---|---|---|---|---|
| Thaps_hclust_0068 |
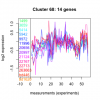 |
 |
0.34 |
36 |
100 |
co2_elevated_stat_arrays | 0.235000 | -0.304 |
| Thaps_hclust_0068 |
 |
 |
0.34 |
36 |
100 |
lowtemp_TMEVA | 0.110000 | -0.489 |
| Thaps_hclust_0068 |
 |
 |
0.34 |
36 |
100 |
highpH_TMEVA | 0.015400 | -0.461 |
| Thaps_hclust_0068 |
 |
 |
0.34 |
36 |
100 |
co2_elevated_expo_arrays | 0.985000 | -0.00972 |
| Thaps_hclust_0068 |
 |
 |
0.34 |
36 |
100 |
lowFe_TMEVA | 0.318000 | -0.313 |
| Thaps_hclust_0068 |
 |
 |
0.34 |
36 |
100 |
exponential_vs_stationary_24light | 0.238000 | 0.427 |
| Thaps_hclust_0068 |
 |
 |
0.34 |
36 |
100 |
lowN_TMEVA | 0.130000 | -0.567 |
| Thaps_hclust_0068 |
 |
 |
0.34 |
36 |
100 |
diel_exponential_vs_stationary | 0.663000 | 0.109 |
| Thaps_hclust_0068 |
 |
 |
0.34 |
36 |
100 |
lowSi_TMEVA | 0.590000 | -0.377 |
| Thaps_hclust_0068 |
 |
 |
0.34 |
36 |
100 |
highlight_arrays | 0.018200 | -0.442 |
| Thaps_hclust_0068 |
 |
 |
0.34 |
36 |
100 |
diel_light_vs_dark | 0.557000 | -0.172 |
| Thaps_hclust_0068 |
 |
 |
0.34 |
36 |
100 |
lowFe_KTKB_Day3 | 0.978000 | -0.00927 |
| Thaps_hclust_0068 |
 |
 |
0.34 |
36 |
100 |
lowFe_KTKB_Day5 | 0.849000 | -0.0516 |
| Thaps_hclust_0068 |
 |
 |
0.34 |
36 |
100 |
BaP | 0.191000 | -0.335 |
| Thaps_hclust_0068 |
 |
 |
0.34 |
36 |
100 |
exponential_vs_stationary_24highlight | 0.080000 | 0.218 |
| Title | Cluster Plot | Dendrogram | e-value | e-value | e-value | Condition | Condition FDR | Condition Difference |
|---|---|---|---|---|---|---|---|---|
| Thaps_hclust_0067 |
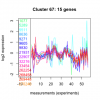 |
 |
0.0036 |
0.86 |
0.11 |
exponential_vs_stationary_24highlight | 0.000526 | 0.5 |
| Thaps_hclust_0067 |
 |
 |
0.0036 |
0.86 |
0.11 |
co2_elevated_stat_arrays | 0.302000 | -0.261 |
| Thaps_hclust_0067 |
 |
 |
0.0036 |
0.86 |
0.11 |
lowtemp_TMEVA | 0.399000 | 0.244 |
| Thaps_hclust_0067 |
 |
 |
0.0036 |
0.86 |
0.11 |
highpH_TMEVA | 0.520000 | -0.125 |
| Thaps_hclust_0067 |
 |
 |
0.0036 |
0.86 |
0.11 |
co2_elevated_expo_arrays | 0.968000 | 0.027 |
