Module 37 Residual: 0.20

Module Page Help

What is a module?

Regulatory units (modules) in the Network Portal are based on the network inference algorithm used. For the current version, modules are based on cMonkey modules and Inferelator regulatory influences on these modules. More specifically, module refers to set of genes that are conditionally co-regulated under subset of the conditions. Identification of modules integrates co-expression, de-novo motif identification, and other functional associations such as operon information and protein-protein interactions.

Expression Profiles

Expression profiles is a plot of the expression ratios (log10) of the module's genes, over all subset of the conditions included in the module. The X-axis represent conditions and the Y-axis represents log10 expression ratios. Each gene is plotted as line plot with different colors. Colored legend for the lines are presented under the plot. This plot is dynamic. Clicking on the gene names in the legend will show/hide the plot for that particular gene. A tooltip will show expression ratio information if you mouseover the lines in the plot.

Motif Locations

Location of the Identified motifs for the module in the upstream regions of the member genes are shown under the expression profiles plot. This plot shows the diagram of the upstream positions of the motifs, colored red and green for motifs #1, and 2, respectively. Intensity of the color is proportional to the significance of the occurence of that motif at a given location. Motifs on the forward and reverse strand are represented over and under the line respectively.

Regulators

For each module, single or AND logic connected regulatory influences are listed under the regulators tab. These regulatory influences are identified by Inferelator. Table shows name of the regulator and its type. tf: Transcription factor, ef: Environmental factor and combiner:Combinatorial influence of a tf or an ef through logic gate. Tabel is sortable by clicking on the arrows next to column headers.

Motifs

Transcription factor binding motifs help to elucidate regulatory mechanism. cMonkey integrates powerful de novo motif detection to identify conditionally co-regulated sets of genes. De novo predicted motifs for each module are listed in the module page as motif logo images along with associated prediction statistics (e-values). The main module page also shows the location of these motifs within the upstream sequences of the module member genes.
Title Model version Residual Score
bicluster_0037 v02 0.20 -12.45

Module Expression Profile Help

How this plot was built?

For the current module we plotted the expression values of the module along time in an ammonia starvation experiment [Boyle et al. 2012]. The thick black line represents the mean expression value for the members of the module. Specifically, it is the log2 fold change with respect to the initial conditions. The gray area specifies a region one standard deviation around the mean expression values. Finally, highlighted at the plot title, we show the first time at which the module mean expression is observed to be above the 2-fold change.
Differential Expression Time:
4 hour
Displaying 1 - 19 of 19
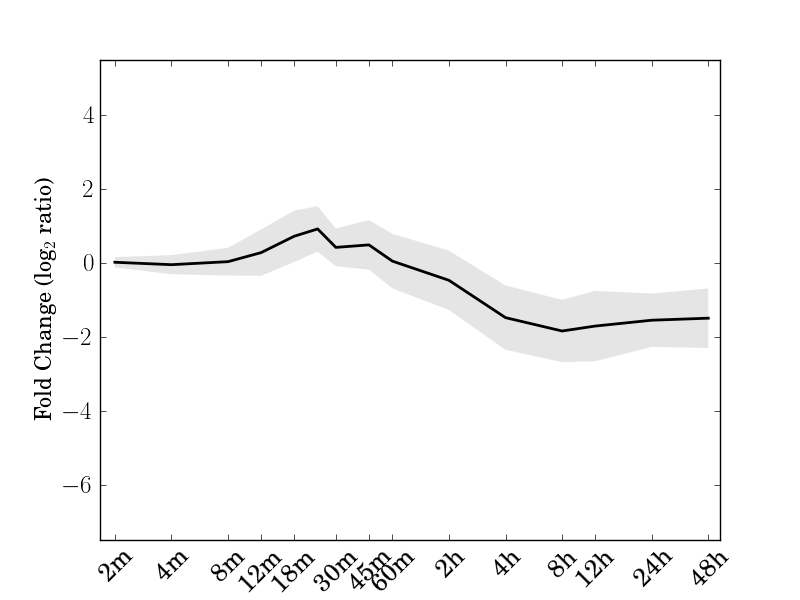
Cre01.g024200.t1.1 cleavage stimulating factor 64

Details for Cre01.g024200.t1.1 - cleavage stimulating factor 64

GO Terms: GO:0003676

Go to Gene Page: Cre01.g024200.t1.1

Phytozome Genomic Region

Cre01.g038600.t1.2 fatty acid desaturase 7

Details for Cre01.g038600.t1.2 - fatty acid desaturase 7

GO Terms: GO:0006629, GO:0016717, GO:0055114

Go to Gene Page: Cre01.g038600.t1.2

Phytozome Genomic Region

Cre02.g088000.t1.2 prohibitin 1

Details for Cre02.g088000.t1.2 - prohibitin 1

GO Terms: NA

Go to Gene Page: Cre02.g088000.t1.2

Phytozome Genomic Region

Cre02.g147300.t1.1

Details for Cre02.g147300.t1.1 -

GO Terms: NA

Go to Gene Page: Cre02.g147300.t1.1

Phytozome Genomic Region

Cre03.g180450.t1.2 5\'-nucleotidase and Flagellar Associated Protein

Details for Cre03.g180450.t1.2 - 5\'-nucleotidase and Flagellar Associated Protein

GO Terms: GO:0016787, GO:0009166

Go to Gene Page: Cre03.g180450.t1.2

Phytozome Genomic Region

Cre03.g183850.t1.2 2Fe-2S ferredoxin-like superfamily protein

Details for Cre03.g183850.t1.2 - 2Fe-2S ferredoxin-like superfamily protein

GO Terms: GO:0009055, GO:0051536

Go to Gene Page: Cre03.g183850.t1.2

Phytozome Genomic Region

Cre04.g215050.t1.2 beta-hydroxylase 1

Details for Cre04.g215050.t1.2 - beta-hydroxylase 1

GO Terms: GO:0005506, GO:0016491, GO:0006633, GO:0055114

Go to Gene Page: Cre04.g215050.t1.2

Phytozome Genomic Region

Cre06.g250100.t1.2 chloroplast heat shock protein 70-2

Details for Cre06.g250100.t1.2 - chloroplast heat shock protein 70-2

GO Terms: NA

Go to Gene Page: Cre06.g250100.t1.2

Phytozome Genomic Region

Cre06.g280650.t1.2 Predicted protein

Details for Cre06.g280650.t1.2 - Predicted protein

GO Terms: NA

Go to Gene Page: Cre06.g280650.t1.2

Phytozome Genomic Region

Cre06.g295450.t1.2 hydroxypyruvate reductase

Details for Cre06.g295450.t1.2 - hydroxypyruvate reductase

GO Terms: GO:0016616, GO:0051287, GO:0008152, GO:0055114, GO:0048037

Go to Gene Page: Cre06.g295450.t1.2

Phytozome Genomic Region

Cre06.g298600.t1.2 zinc ion binding

Details for Cre06.g298600.t1.2 - zinc ion binding

GO Terms: NA

Go to Gene Page: Cre06.g298600.t1.2

Phytozome Genomic Region

Cre06.g309100.t1.2 heat shock protein 60

Details for Cre06.g309100.t1.2 - heat shock protein 60

GO Terms: GO:0005524, GO:0044267

Go to Gene Page: Cre06.g309100.t1.2

Phytozome Genomic Region

Cre07.g324200.t1.2 Diacylglyceryl-N,N,N-trimethylhomoserine synthesis protein

Details for Cre07.g324200.t1.2 - Diacylglyceryl-N,N,N-trimethylhomoserine synthesis protein

GO Terms: GO:0008168

Go to Gene Page: Cre07.g324200.t1.2

Phytozome Genomic Region

Cre07.g328200.t1.2 Mog1/PsbP/DUF1795-like photosystem II reaction center PsbP family protein

Details for Cre07.g328200.t1.2 - Mog1/PsbP/DUF1795-like photosystem II reaction center PsbP family protein

GO Terms: NA

Go to Gene Page: Cre07.g328200.t1.2

Phytozome Genomic Region

Cre09.g392579.t1.1

Details for Cre09.g392579.t1.1 -

GO Terms: NA

Go to Gene Page: Cre09.g392579.t1.1

Phytozome Genomic Region

Cre09.g393200.t1.2 mitochondrial HSO70 2

Details for Cre09.g393200.t1.2 - mitochondrial HSO70 2

GO Terms: NA

Go to Gene Page: Cre09.g393200.t1.2

Phytozome Genomic Region

Cre12.g522500.t1.1

Details for Cre12.g522500.t1.1 -

GO Terms: NA

Go to Gene Page: Cre12.g522500.t1.1

Phytozome Genomic Region

Cre13.g566000.t1.2 10-formyltetrahydrofolate synthetase

Details for Cre13.g566000.t1.2 - 10-formyltetrahydrofolate synthetase

GO Terms: GO:0004329, GO:0005524, GO:0009396

Go to Gene Page: Cre13.g566000.t1.2

Phytozome Genomic Region

Cre17.g726400.t1.1 LAG1 homologue 2

Details for Cre17.g726400.t1.1 - LAG1 homologue 2

GO Terms: GO:0016021

Go to Gene Page: Cre17.g726400.t1.1

Phytozome Genomic Region

motif_0037_1

e.value: 
0.000069
Motif Bicluster: 
Width: 
21
Number of Sites: 
1
Consensus: 
CncCGCCActGcCnCCgCCac

motif_0037_2

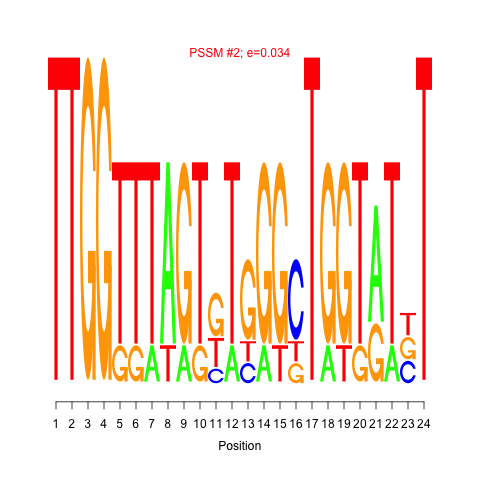
e.value: 
0.034
Motif Bicluster: 
Width: 
24
Number of Sites: 
1
Consensus: 
TTGGTTTAGTgTgGGcTGGTaTnT
Displaying 1 - 3 of 3
Interaction Weight
down-regulates 0.045278
down-regulates 0.048316
down-regulates 0.054795
Displaying 1 - 1 of 1
GO Terms Descriptions
Not available
Log in to post comments