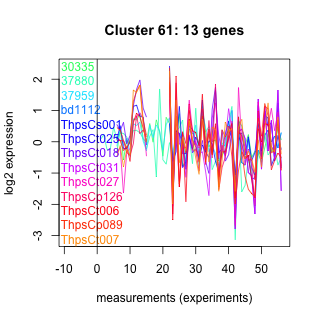
Thaps_hclust_0061 Hierarchical Clustering
Thalassiosira pseudonana
| Cluster Plot | Conditions Plot | Dendrogram |
|---|---|---|
 |
 |
 |
|
30335 : hypothetical protein |
ThpsCs001 : (ssra) |
ThpsCt031 : (trnP(ugg)') |
ThpsCt006 : (trnW(cca)) |
|
37880 : rRNA intron-encoded homing endonuclease |
ThpsCt025 : (trnL(uaa)) |
ThpsCt027 : (trnN(guu)) |
ThpsCp089 : (rps16) ribosomal protein S16 |
|
37959 : hypothetical protein |
ThpsCt018 : (trnP(ugg)) |
ThpsCp126 : (thiG) thiamin biosynthesis protein G |
ThpsCt007 : (trnT(ugu)) |
|
bd1112 : (bd1112) NA |
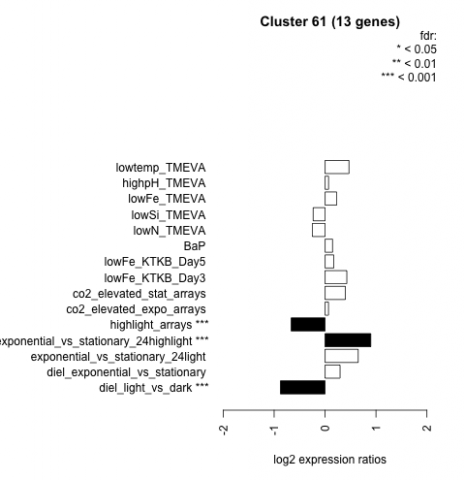
| Condition | Condition | Difference | FDR |
|---|---|---|---|
| diel_light_vs_dark | diel_light_vs_dark | -0.876 | 0.000926 |
| lowFe_KTKB_Day3 | lowFe_KTKB_Day3 | 0.428 | 0.141 |
| lowFe_KTKB_Day5 | lowFe_KTKB_Day5 | 0.171 | 0.518 |
| BaP | BaP | 0.148 | 0.616 |
| exponential_vs_stationary_24highlight | exponential_vs_stationary_24highlight | 0.898 | 0.000526 |
| co2_elevated_stat_arrays | co2_elevated_stat_arrays | 0.398 | 0.122 |
| lowtemp_TMEVA | lowtemp_TMEVA | 0.470 | 0.131 |
| highpH_TMEVA | highpH_TMEVA | 0.069 | 0.771 |
| co2_elevated_expo_arrays | co2_elevated_expo_arrays | 0.068 | 0.873 |
| lowFe_TMEVA | lowFe_TMEVA | 0.229 | 0.467 |
| exponential_vs_stationary_24light | exponential_vs_stationary_24light | 0.650 | 0.0836 |
| lowN_TMEVA | lowN_TMEVA | -0.250 | 0.532 |
| diel_exponential_vs_stationary | diel_exponential_vs_stationary | 0.295 | 0.187 |
| lowSi_TMEVA | lowSi_TMEVA | -0.233 | 0.838 |
| highlight_arrays | highlight_arrays | -0.666 | 0.000442 |