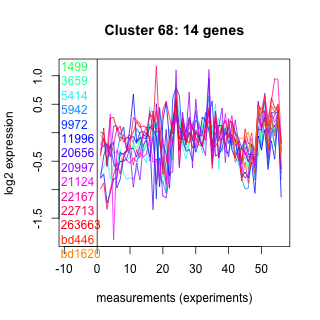
Thaps_hclust_0068 Hierarchical Clustering
Thalassiosira pseudonana
| Cluster Plot | Conditions Plot | Dendrogram |
|---|---|---|
 |
 |
 |
| GO ID | Go Term | p-value | q-value | Cluster |
|---|---|---|---|---|
| GO:0000918 | selection of site for barrier septum formation | 0.000620219 | 1 | Thaps_hclust_0068 |
| GO:0006423 | cysteinyl-tRNA aminoacylation | 0.00185989 | 1 | Thaps_hclust_0068 |
| GO:0006810 | transport | 0.109856 | 1 | Thaps_hclust_0068 |
|
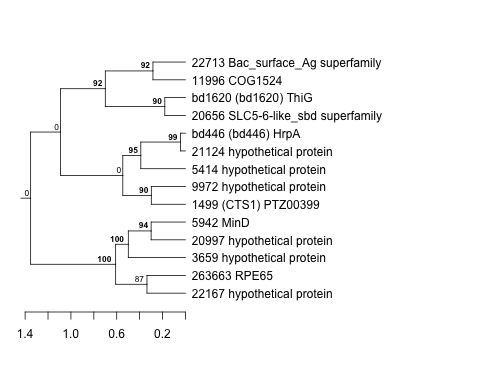
1499 : (CTS1) PTZ00399 |
9972 : hypothetical protein |
21124 : hypothetical protein |
263663 : RPE65 |
|
3659 : hypothetical protein |
11996 : COG1524 |
22167 : hypothetical protein |
bd446 : (bd446) HrpA |
|
5414 : hypothetical protein |
20656 : SLC5-6-like_sbd superfamily |
22713 : Bac_surface_Ag superfamily |
bd1620 : (bd1620) ThiG |
|
5942 : MinD |
20997 : hypothetical protein |
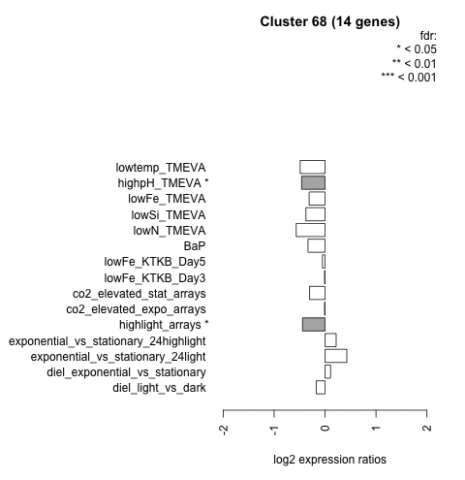
| Condition | Condition | Difference | FDR |
|---|---|---|---|
| diel_light_vs_dark | diel_light_vs_dark | -0.172 | 0.557 |
| lowFe_KTKB_Day3 | lowFe_KTKB_Day3 | -0.009 | 0.978 |
| lowFe_KTKB_Day5 | lowFe_KTKB_Day5 | -0.052 | 0.849 |
| BaP | BaP | -0.335 | 0.191 |
| exponential_vs_stationary_24highlight | exponential_vs_stationary_24highlight | 0.218 | 0.08 |
| co2_elevated_stat_arrays | co2_elevated_stat_arrays | -0.304 | 0.235 |
| lowtemp_TMEVA | lowtemp_TMEVA | -0.489 | 0.11 |
| highpH_TMEVA | highpH_TMEVA | -0.461 | 0.0154 |
| co2_elevated_expo_arrays | co2_elevated_expo_arrays | -0.010 | 0.985 |
| lowFe_TMEVA | lowFe_TMEVA | -0.313 | 0.318 |
| exponential_vs_stationary_24light | exponential_vs_stationary_24light | 0.427 | 0.238 |
| lowN_TMEVA | lowN_TMEVA | -0.567 | 0.13 |
| diel_exponential_vs_stationary | diel_exponential_vs_stationary | 0.109 | 0.663 |
| lowSi_TMEVA | lowSi_TMEVA | -0.377 | 0.59 |
| highlight_arrays | highlight_arrays | -0.442 | 0.0182 |