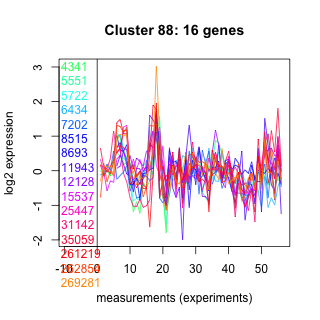
Thaps_hclust_0088 Hierarchical Clustering
Thalassiosira pseudonana
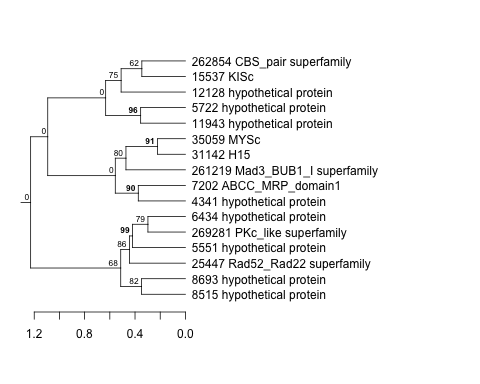
| Cluster Plot | Conditions Plot | Dendrogram |
|---|---|---|
 |
 |
 |
| GO ID | Go Term | p-value | q-value | Cluster |
|---|---|---|---|---|
| GO:0007018 | microtubule-based movement | 0.0264385 | 1 | Thaps_hclust_0088 |
| GO:0006468 | protein amino acid phosphorylation | 0.1264 | 1 | Thaps_hclust_0088 |
| GO:0006355 | regulation of transcription, DNA-dependent | 0.178613 | 1 | Thaps_hclust_0088 |
|
4341 : hypothetical protein |
7202 : ABCC_MRP_domain1 |
12128 : hypothetical protein |
35059 : MYSc |
|
5551 : hypothetical protein |
8515 : hypothetical protein |
15537 : KISc |
261219 : Mad3_BUB1_I superfamily |
|
5722 : hypothetical protein |
8693 : hypothetical protein |
25447 : Rad52_Rad22 superfamily |
262854 : CBS_pair superfamily |
|
6434 : hypothetical protein |
11943 : hypothetical protein |
31142 : H15 |
269281 : PKc_like superfamily |
| Condition | Condition | Difference | FDR |
|---|---|---|---|
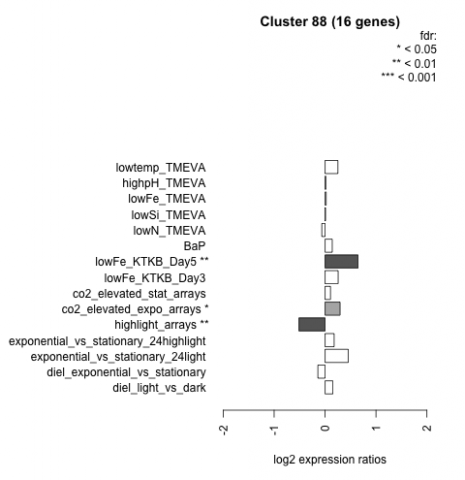
| diel_light_vs_dark | diel_light_vs_dark | 0.153 | 0.577 |
| lowFe_KTKB_Day3 | lowFe_KTKB_Day3 | 0.257 | 0.357 |
| lowFe_KTKB_Day5 | lowFe_KTKB_Day5 | 0.648 | 0.0051 |
| BaP | BaP | 0.141 | 0.6 |
| exponential_vs_stationary_24highlight | exponential_vs_stationary_24highlight | 0.178 | 0.132 |
| co2_elevated_stat_arrays | co2_elevated_stat_arrays | 0.107 | 0.706 |
| lowtemp_TMEVA | lowtemp_TMEVA | 0.252 | 0.385 |
| highpH_TMEVA | highpH_TMEVA | 0.016 | 0.964 |
| co2_elevated_expo_arrays | co2_elevated_expo_arrays | 0.295 | 0.0479 |
| lowFe_TMEVA | lowFe_TMEVA | 0.022 | 0.974 |
| exponential_vs_stationary_24light | exponential_vs_stationary_24light | 0.455 | 0.189 |
| lowN_TMEVA | lowN_TMEVA | -0.063 | 0.861 |
| diel_exponential_vs_stationary | diel_exponential_vs_stationary | -0.141 | 0.533 |
| lowSi_TMEVA | lowSi_TMEVA | 0.010 | 1 |
| highlight_arrays | highlight_arrays | -0.513 | 0.00317 |