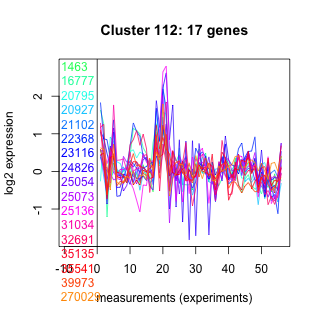
Thaps_hclust_0112 Hierarchical Clustering
Thalassiosira pseudonana
| Cluster Plot | Conditions Plot | Dendrogram |
|---|---|---|
 |
 |
 |
| GO ID | Go Term | p-value | q-value | Cluster |
|---|---|---|---|---|
| GO:0007049 | cell cycle | 0.0115273 | 1 | Thaps_hclust_0112 |
| GO:0006094 | gluconeogenesis | 0.0147993 | 1 | Thaps_hclust_0112 |
| GO:0006813 | potassium ion transport | 0.0358377 | 1 | Thaps_hclust_0112 |
| GO:0006096 | glycolysis | 0.0596234 | 1 | Thaps_hclust_0112 |
| GO:0008152 | metabolism | 0.141031 | 1 | Thaps_hclust_0112 |
| GO:0006457 | protein folding | 0.195964 | 1 | Thaps_hclust_0112 |
| GO:0006468 | protein amino acid phosphorylation | 0.302703 | 1 | Thaps_hclust_0112 |
|
1463 : hypothetical protein |
22368 : MRP-like |
25073 : hypothetical protein |
35135 : PKc_like superfamily |
|
16777 : Abhydrolase_5 |
23116 : hypothetical protein |
25136 : Solute_trans_a superfamily |
35541 : Cis_IPPS |
|
20795 : SCP_euk |
24826 : hypothetical protein |
31034 : cyclophilin superfamily |
39973 : (GPI3) PLN02649 |
|
20927 : RhaT |
25054 : hypothetical protein |
32691 : BTB |
270029 : (cul1) Cullin |
|
21102 : Sulfotransfer_3 |
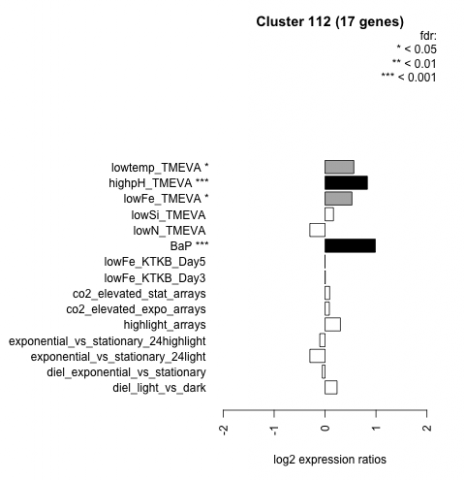
| Condition | Condition | Difference | FDR |
|---|---|---|---|
| diel_light_vs_dark | diel_light_vs_dark | 0.235 | 0.32 |
| lowFe_KTKB_Day3 | lowFe_KTKB_Day3 | 0.003 | 0.994 |
| lowFe_KTKB_Day5 | lowFe_KTKB_Day5 | -0.001 | 1 |
| BaP | BaP | 0.987 | 0.00037 |
| exponential_vs_stationary_24highlight | exponential_vs_stationary_24highlight | -0.103 | 0.394 |
| co2_elevated_stat_arrays | co2_elevated_stat_arrays | 0.091 | 0.742 |
| lowtemp_TMEVA | lowtemp_TMEVA | 0.565 | 0.0425 |
| highpH_TMEVA | highpH_TMEVA | 0.831 | 0.000725 |
| co2_elevated_expo_arrays | co2_elevated_expo_arrays | 0.084 | 0.802 |
| lowFe_TMEVA | lowFe_TMEVA | 0.528 | 0.0494 |
| exponential_vs_stationary_24light | exponential_vs_stationary_24light | -0.298 | 0.402 |
| lowN_TMEVA | lowN_TMEVA | -0.299 | 0.416 |
| diel_exponential_vs_stationary | diel_exponential_vs_stationary | -0.054 | 0.816 |
| lowSi_TMEVA | lowSi_TMEVA | 0.165 | 0.936 |
| highlight_arrays | highlight_arrays | 0.301 | 0.0741 |