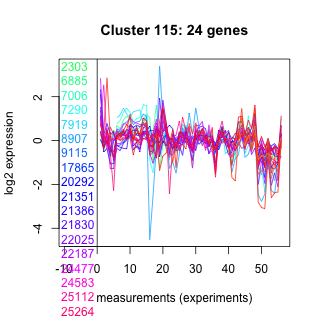
Thaps_hclust_0115 Hierarchical Clustering
Thalassiosira pseudonana
| Cluster Plot | Conditions Plot | Dendrogram |
|---|---|---|
 |
 |
 |
| GO ID | Go Term | p-value | q-value | Cluster |
|---|---|---|---|---|
| GO:0006788 | heme oxidation | 0.00144718 | 1 | Thaps_hclust_0115 |
| GO:0006457 | protein folding | 0.013778 | 1 | Thaps_hclust_0115 |
| GO:0006468 | protein amino acid phosphorylation | 0.270534 | 1 | Thaps_hclust_0115 |
| GO:0006118 | electron transport | 0.327122 | 1 | Thaps_hclust_0115 |
| GO:0006508 | proteolysis and peptidolysis | 0.349482 | 1 | Thaps_hclust_0115 |
| GO:0006355 | regulation of transcription, DNA-dependent | 0.368277 | 1 | Thaps_hclust_0115 |
|
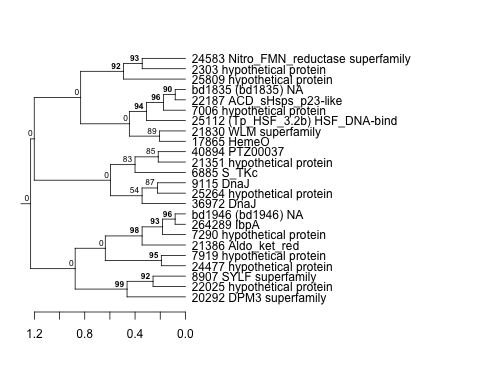
2303 : hypothetical protein |
9115 : DnaJ |
22025 : hypothetical protein |
25809 : hypothetical protein |
|
6885 : S_TKc |
17865 : HemeO |
22187 : ACD_sHsps_p23-like |
36972 : DnaJ |
|
7006 : hypothetical protein |
20292 : DPM3 superfamily |
24477 : hypothetical protein |
40894 : PTZ00037 |
|
7290 : hypothetical protein |
21351 : hypothetical protein |
24583 : Nitro_FMN_reductase superfamily |
264289 : IbpA |
|
7919 : hypothetical protein |
21386 : Aldo_ket_red |
25112 : (Tp_HSF_3.2b) HSF_DNA-bind |
bd1946 : (bd1946) NA |
|
8907 : SYLF superfamily |
21830 : WLM superfamily |
25264 : hypothetical protein |
bd1835 : (bd1835) NA |
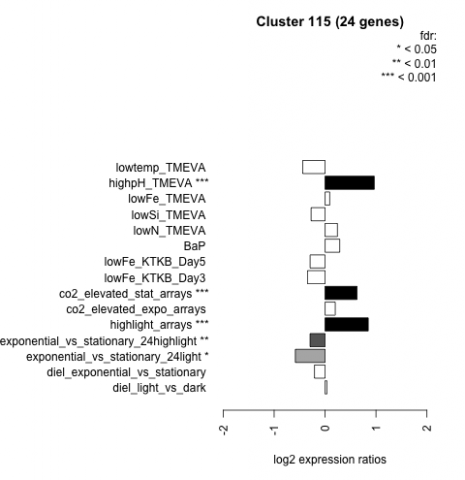
| Condition | Condition | Difference | FDR |
|---|---|---|---|
| diel_light_vs_dark | diel_light_vs_dark | 0.036 | 0.91 |
| lowFe_KTKB_Day3 | lowFe_KTKB_Day3 | -0.345 | 0.0967 |
| lowFe_KTKB_Day5 | lowFe_KTKB_Day5 | -0.293 | 0.105 |
| BaP | BaP | 0.288 | 0.137 |
| exponential_vs_stationary_24highlight | exponential_vs_stationary_24highlight | -0.295 | 0.0021 |
| co2_elevated_stat_arrays | co2_elevated_stat_arrays | 0.627 | 0.000658 |
| lowtemp_TMEVA | lowtemp_TMEVA | -0.439 | 0.0578 |
| highpH_TMEVA | highpH_TMEVA | 0.966 | 0.000725 |
| co2_elevated_expo_arrays | co2_elevated_expo_arrays | 0.200 | 0.159 |
| lowFe_TMEVA | lowFe_TMEVA | 0.092 | 0.813 |
| exponential_vs_stationary_24light | exponential_vs_stationary_24light | -0.584 | 0.0363 |
| lowN_TMEVA | lowN_TMEVA | 0.243 | 0.479 |
| diel_exponential_vs_stationary | diel_exponential_vs_stationary | -0.208 | 0.207 |
| lowSi_TMEVA | lowSi_TMEVA | -0.274 | 0.738 |
| highlight_arrays | highlight_arrays | 0.848 | 0.000442 |