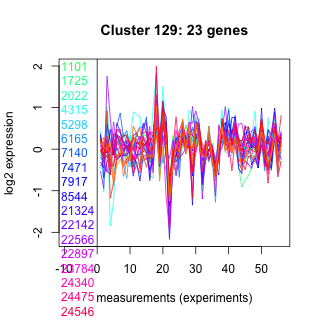
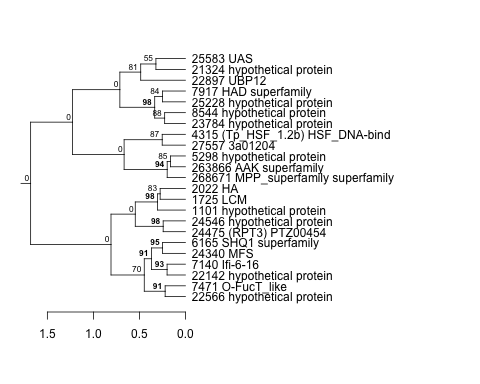
Thaps_hclust_0129 Hierarchical Clustering
Thalassiosira pseudonana
| Cluster Plot | Conditions Plot | Dendrogram |
|---|---|---|
 |
 |
 |
| GO ID | Go Term | p-value | q-value | Cluster |
|---|---|---|---|---|
| GO:0009613 | response to pest, pathogen or parasite | 0.0111179 | 1 | Thaps_hclust_0129 |
| GO:0008652 | amino acid biosynthesis | 0.0135745 | 1 | Thaps_hclust_0129 |
| GO:0030163 | protein catabolism | 0.016026 | 1 | Thaps_hclust_0129 |
| GO:0006512 | ubiquitin cycle | 0.0438553 | 1 | Thaps_hclust_0129 |
| GO:0006511 | ubiquitin-dependent protein catabolism | 0.0616491 | 1 | Thaps_hclust_0129 |
| GO:0006355 | regulation of transcription, DNA-dependent | 0.325408 | 1 | Thaps_hclust_0129 |
|
1101 : hypothetical protein |
7140 : Ifi-6-16 |
22566 : hypothetical protein |
25228 : hypothetical protein |
|
1725 : LCM |
7471 : O-FucT_like |
22897 : UBP12 |
25583 : UAS |
|
2022 : HA |
7917 : HAD superfamily |
23784 : hypothetical protein |
27557 : 3a01204 |
|
4315 : (Tp_HSF_1.2b) HSF_DNA-bind |
8544 : hypothetical protein |
24340 : MFS |
263866 : AAK superfamily |
|
5298 : hypothetical protein |
21324 : hypothetical protein |
24475 : (RPT3) PTZ00454 |
268671 : MPP_superfamily superfamily |
|
6165 : SHQ1 superfamily |
22142 : hypothetical protein |
24546 : hypothetical protein |
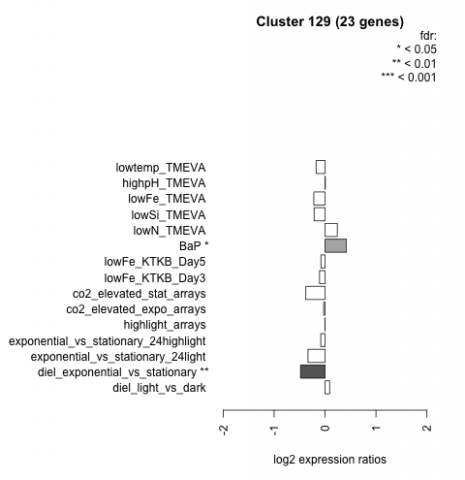
| Condition | Condition | Difference | FDR |
|---|---|---|---|
| diel_light_vs_dark | diel_light_vs_dark | 0.091 | 0.719 |
| lowFe_KTKB_Day3 | lowFe_KTKB_Day3 | -0.109 | 0.68 |
| lowFe_KTKB_Day5 | lowFe_KTKB_Day5 | -0.080 | 0.702 |
| BaP | BaP | 0.420 | 0.038 |
| exponential_vs_stationary_24highlight | exponential_vs_stationary_24highlight | -0.084 | 0.425 |
| co2_elevated_stat_arrays | co2_elevated_stat_arrays | -0.379 | 0.062 |
| lowtemp_TMEVA | lowtemp_TMEVA | -0.175 | 0.471 |
| highpH_TMEVA | highpH_TMEVA | 0.005 | 0.992 |
| co2_elevated_expo_arrays | co2_elevated_expo_arrays | -0.027 | 0.968 |
| lowFe_TMEVA | lowFe_TMEVA | -0.221 | 0.42 |
| exponential_vs_stationary_24light | exponential_vs_stationary_24light | -0.335 | 0.263 |
| lowN_TMEVA | lowN_TMEVA | 0.241 | 0.486 |
| diel_exponential_vs_stationary | diel_exponential_vs_stationary | -0.480 | 0.00425 |
| lowSi_TMEVA | lowSi_TMEVA | -0.213 | 0.844 |
| highlight_arrays | highlight_arrays | 0.001 | 0.988 |