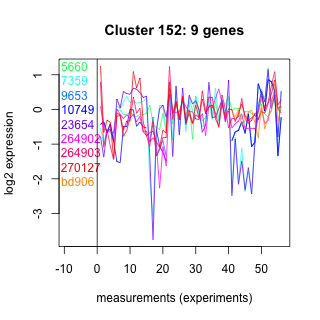
Thaps_hclust_0152 Hierarchical Clustering
Thalassiosira pseudonana
| Cluster Plot | Conditions Plot | Dendrogram |
|---|---|---|
 |
 |
 |
| GO ID | Go Term | p-value | q-value | Cluster |
|---|---|---|---|---|
| GO:0006030 | chitin metabolism | 0.0426158 | 1 | Thaps_hclust_0152 |
| GO:0008152 | metabolism | 0.0454147 | 1 | Thaps_hclust_0152 |
| GO:0006418 | tRNA aminoacylation for protein translation | 0.111884 | 1 | Thaps_hclust_0152 |
| GO:0006508 | proteolysis and peptidolysis | 0.115922 | 1 | Thaps_hclust_0152 |
| GO:0006355 | regulation of transcription, DNA-dependent | 0.129013 | 1 | Thaps_hclust_0152 |
| GO:0005975 | carbohydrate metabolism | 0.144797 | 1 | Thaps_hclust_0152 |
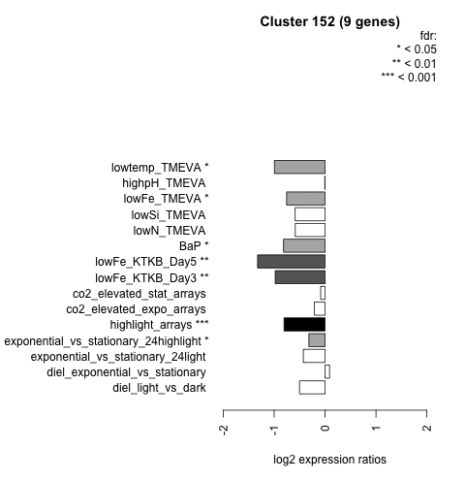
| Condition | Condition | Difference | FDR |
|---|---|---|---|
| diel_light_vs_dark | diel_light_vs_dark | -0.500 | 0.1 |
| lowFe_KTKB_Day3 | lowFe_KTKB_Day3 | -0.979 | 0.00685 |
| lowFe_KTKB_Day5 | lowFe_KTKB_Day5 | -1.320 | 0.00132 |
| BaP | BaP | -0.816 | 0.0138 |
| exponential_vs_stationary_24highlight | exponential_vs_stationary_24highlight | -0.318 | 0.0403 |
| co2_elevated_stat_arrays | co2_elevated_stat_arrays | -0.086 | 0.801 |
| lowtemp_TMEVA | lowtemp_TMEVA | -0.993 | 0.0174 |
| highpH_TMEVA | highpH_TMEVA | -0.005 | 0.997 |
| co2_elevated_expo_arrays | co2_elevated_expo_arrays | -0.211 | 0.399 |
| lowFe_TMEVA | lowFe_TMEVA | -0.755 | 0.0474 |
| exponential_vs_stationary_24light | exponential_vs_stationary_24light | -0.426 | 0.348 |
| lowN_TMEVA | lowN_TMEVA | -0.585 | 0.199 |
| diel_exponential_vs_stationary | diel_exponential_vs_stationary | 0.089 | 0.779 |
| lowSi_TMEVA | lowSi_TMEVA | -0.589 | 0.368 |
| highlight_arrays | highlight_arrays | -0.805 | 0.000442 |