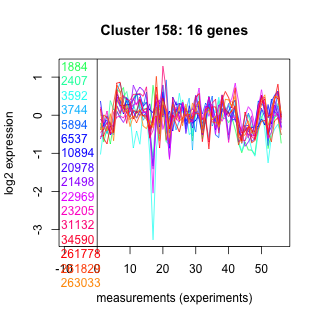
Thaps_hclust_0158 Hierarchical Clustering
Thalassiosira pseudonana
| Cluster Plot | Conditions Plot | Dendrogram |
|---|---|---|
 |
 |
 |
| GO ID | Go Term | p-value | q-value | Cluster |
|---|---|---|---|---|
| GO:0006259 | DNA metabolism | 0.00865975 | 1 | Thaps_hclust_0158 |
| GO:0006260 | DNA replication | 0.0215554 | 1 | Thaps_hclust_0158 |
| GO:0006810 | transport | 0.109856 | 1 | Thaps_hclust_0158 |
|
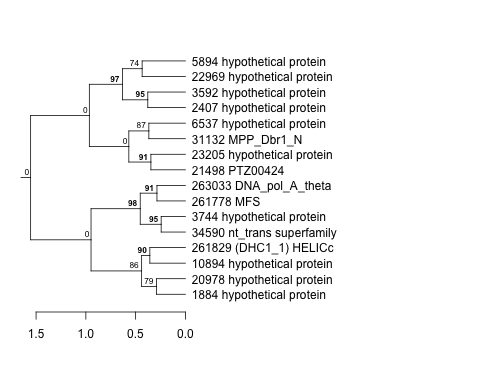
1884 : hypothetical protein |
5894 : hypothetical protein |
21498 : PTZ00424 |
34590 : nt_trans superfamily |
|
2407 : hypothetical protein |
6537 : hypothetical protein |
22969 : hypothetical protein |
261778 : MFS |
|
3592 : hypothetical protein |
10894 : hypothetical protein |
23205 : hypothetical protein |
261829 : (DHC1_1) HELICc |
|
3744 : hypothetical protein |
20978 : hypothetical protein |
31132 : MPP_Dbr1_N |
263033 : DNA_pol_A_theta |
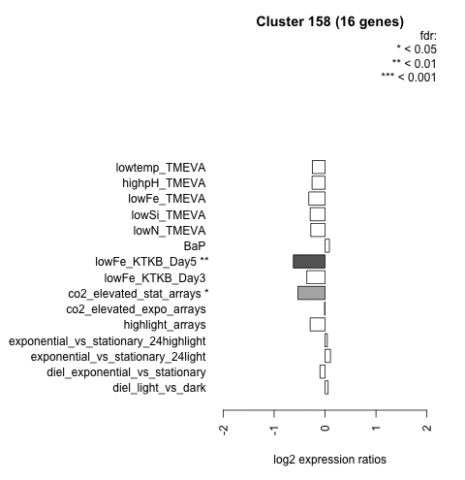
| Condition | Condition | Difference | FDR |
|---|---|---|---|
| diel_light_vs_dark | diel_light_vs_dark | 0.059 | 0.863 |
| lowFe_KTKB_Day3 | lowFe_KTKB_Day3 | -0.359 | 0.165 |
| lowFe_KTKB_Day5 | lowFe_KTKB_Day5 | -0.623 | 0.00741 |
| BaP | BaP | 0.085 | 0.766 |
| exponential_vs_stationary_24highlight | exponential_vs_stationary_24highlight | 0.044 | 0.746 |
| co2_elevated_stat_arrays | co2_elevated_stat_arrays | -0.536 | 0.0177 |
| lowtemp_TMEVA | lowtemp_TMEVA | -0.248 | 0.388 |
| highpH_TMEVA | highpH_TMEVA | -0.255 | 0.138 |
| co2_elevated_expo_arrays | co2_elevated_expo_arrays | -0.009 | 0.985 |
| lowFe_TMEVA | lowFe_TMEVA | -0.321 | 0.3 |
| exponential_vs_stationary_24light | exponential_vs_stationary_24light | 0.106 | 0.813 |
| lowN_TMEVA | lowN_TMEVA | -0.281 | 0.476 |
| diel_exponential_vs_stationary | diel_exponential_vs_stationary | -0.099 | 0.678 |
| lowSi_TMEVA | lowSi_TMEVA | -0.291 | 0.734 |
| highlight_arrays | highlight_arrays | -0.293 | 0.0873 |