Thaps_hclust_0184 Hierarchical Clustering
Thalassiosira pseudonana
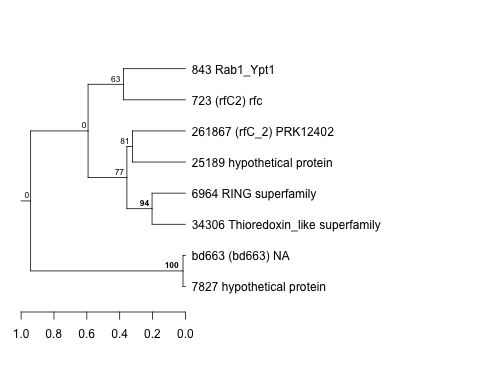
| Cluster Plot | Conditions Plot | Dendrogram |
|---|---|---|
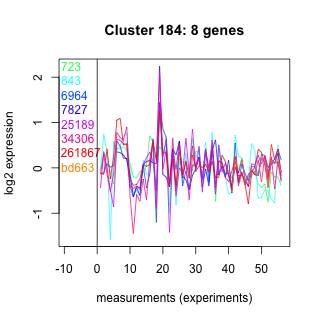 |
 |
 |
| GO ID | Go Term | p-value | q-value | Cluster |
|---|---|---|---|---|
| GO:0006260 | DNA replication | 0.00138603 | 1 | Thaps_hclust_0184 |
| GO:0000160 | two-component signal transduction system (phosphorelay) | 0.0438241 | 1 | Thaps_hclust_0184 |
| GO:0007264 | small GTPase mediated signal transduction | 0.0549078 | 1 | Thaps_hclust_0184 |
| GO:0015031 | protein transport | 0.068993 | 1 | Thaps_hclust_0184 |
| GO:0006886 | intracellular protein transport | 0.0859585 | 1 | Thaps_hclust_0184 |
| GO:0006118 | electron transport | 0.364179 | 1 | Thaps_hclust_0184 |
| GO:0006355 | regulation of transcription, DNA-dependent | 0.40843 | 1 | Thaps_hclust_0184 |
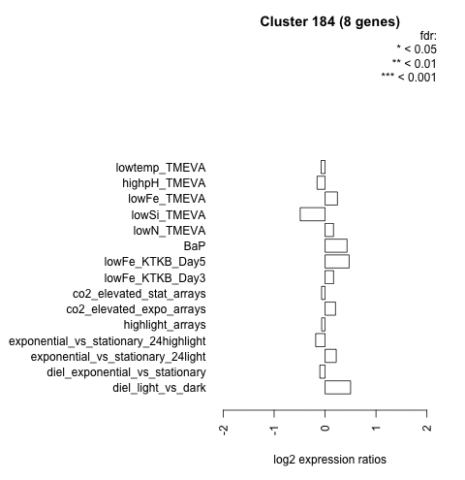
| Condition | Condition | Difference | FDR |
|---|---|---|---|
| diel_light_vs_dark | diel_light_vs_dark | 0.501 | 0.114 |
| lowFe_KTKB_Day3 | lowFe_KTKB_Day3 | 0.167 | 0.686 |
| lowFe_KTKB_Day5 | lowFe_KTKB_Day5 | 0.473 | 0.142 |
| BaP | BaP | 0.432 | 0.211 |
| exponential_vs_stationary_24highlight | exponential_vs_stationary_24highlight | -0.184 | 0.274 |
| co2_elevated_stat_arrays | co2_elevated_stat_arrays | -0.069 | 0.847 |
| lowtemp_TMEVA | lowtemp_TMEVA | -0.077 | 0.859 |
| highpH_TMEVA | highpH_TMEVA | -0.157 | 0.533 |
| co2_elevated_expo_arrays | co2_elevated_expo_arrays | 0.206 | 0.429 |
| lowFe_TMEVA | lowFe_TMEVA | 0.243 | 0.526 |
| exponential_vs_stationary_24light | exponential_vs_stationary_24light | 0.220 | 0.684 |
| lowN_TMEVA | lowN_TMEVA | 0.166 | 0.725 |
| diel_exponential_vs_stationary | diel_exponential_vs_stationary | -0.102 | 0.752 |
| lowSi_TMEVA | lowSi_TMEVA | -0.488 | 0.5 |
| highlight_arrays | highlight_arrays | -0.067 | 0.806 |