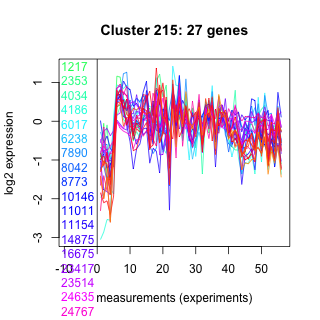
Thaps_hclust_0215 Hierarchical Clustering
Thalassiosira pseudonana
| Cluster Plot | Conditions Plot | Dendrogram |
|---|---|---|
 |
 |
 |
| GO ID | Go Term | p-value | q-value | Cluster |
|---|---|---|---|---|
| GO:0009058 | biosynthesis | 0.00257046 | 1 | Thaps_hclust_0215 |
| GO:0015840 | urea transport | 0.00289256 | 1 | Thaps_hclust_0215 |
| GO:0006306 | DNA methylation | 0.0412459 | 1 | Thaps_hclust_0215 |
| GO:0006629 | lipid metabolism | 0.0412459 | 1 | Thaps_hclust_0215 |
| GO:0006457 | protein folding | 0.173725 | 1 | Thaps_hclust_0215 |
| GO:0006118 | electron transport | 0.327122 | 1 | Thaps_hclust_0215 |
|
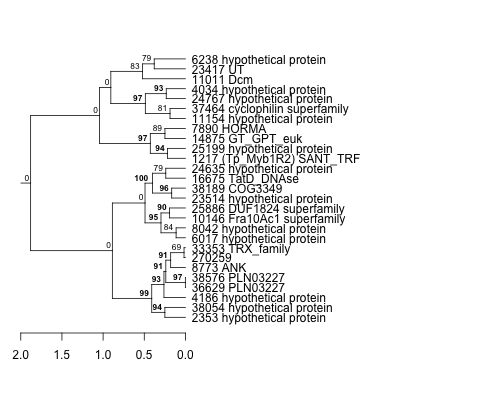
1217 : (Tp_Myb1R2) SANT_TRF |
8042 : hypothetical protein |
23417 : UT |
36629 : PLN03227 |
|
2353 : hypothetical protein |
8773 : ANK |
23514 : hypothetical protein |
37464 : cyclophilin superfamily |
|
4034 : hypothetical protein |
10146 : Fra10Ac1 superfamily |
24635 : hypothetical protein |
38054 : hypothetical protein |
|
4186 : hypothetical protein |
11011 : Dcm |
24767 : hypothetical protein |
38189 : COG3349 |
|
6017 : hypothetical protein |
11154 : hypothetical protein |
25199 : hypothetical protein |
38576 : PLN03227 |
|
6238 : hypothetical protein |
14875 : GT_GPT_euk |
25886 : DUF1824 superfamily |
270259 : |
|
7890 : HORMA |
16675 : TatD_DNAse |
33353 : TRX_family |
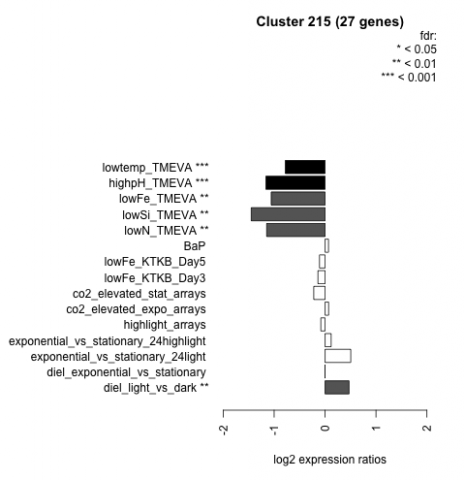
| Condition | Condition | Difference | FDR |
|---|---|---|---|
| highpH_TMEVA | highpH_TMEVA | -1.160 | 0.000725 |
| lowtemp_TMEVA | lowtemp_TMEVA | -0.780 | 0.000735 |
| lowFe_TMEVA | lowFe_TMEVA | -1.060 | 0.00104 |
| lowN_TMEVA | lowN_TMEVA | -1.150 | 0.00119 |
| lowSi_TMEVA | lowSi_TMEVA | -1.450 | 0.00135 |
| diel_light_vs_dark | diel_light_vs_dark | 0.471 | 0.00484 |
| exponential_vs_stationary_24light | exponential_vs_stationary_24light | 0.505 | 0.062 |
| exponential_vs_stationary_24highlight | exponential_vs_stationary_24highlight | 0.119 | 0.197 |
| co2_elevated_stat_arrays | co2_elevated_stat_arrays | -0.222 | 0.3 |
| lowFe_KTKB_Day3 | lowFe_KTKB_Day3 | -0.139 | 0.545 |
| lowFe_KTKB_Day5 | lowFe_KTKB_Day5 | -0.110 | 0.561 |
| highlight_arrays | highlight_arrays | -0.083 | 0.59 |
| BaP | BaP | 0.068 | 0.766 |
| co2_elevated_expo_arrays | co2_elevated_expo_arrays | 0.070 | 0.833 |
| diel_exponential_vs_stationary | diel_exponential_vs_stationary | -0.001 | 0.998 |