Thaps_hclust_0233 Hierarchical Clustering
Thalassiosira pseudonana
| Cluster Plot | Conditions Plot | Dendrogram |
|---|---|---|
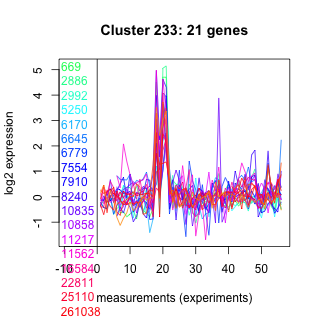 |
 |
 |
| GO ID | Go Term | p-value | q-value | Cluster |
|---|---|---|---|---|
| GO:0007264 | small GTPase mediated signal transduction | 0.0482078 | 1 | Thaps_hclust_0233 |
| GO:0015031 | protein transport | 0.06063 | 1 | Thaps_hclust_0233 |
| GO:0006886 | intracellular protein transport | 0.0756238 | 1 | Thaps_hclust_0233 |
| GO:0006468 | protein amino acid phosphorylation | 0.270534 | 1 | Thaps_hclust_0233 |
| GO:0006118 | electron transport | 0.327122 | 1 | Thaps_hclust_0233 |
| GO:0006508 | proteolysis and peptidolysis | 0.349482 | 1 | Thaps_hclust_0233 |
| GO:0008152 | metabolism | 0.459719 | 1 | Thaps_hclust_0233 |
|
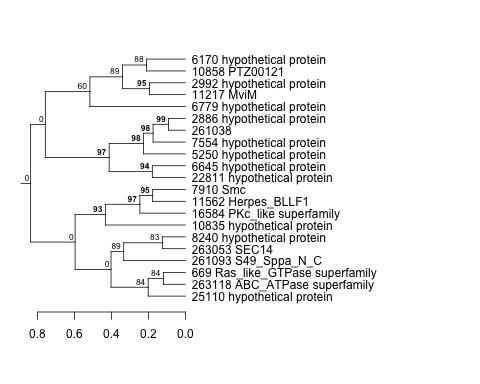
669 : Ras_like_GTPase superfamily |
6779 : hypothetical protein |
10858 : PTZ00121 |
25110 : hypothetical protein |
|
2886 : hypothetical protein |
7554 : hypothetical protein |
11217 : MviM |
261038 : |
|
2992 : hypothetical protein |
7910 : Smc |
11562 : Herpes_BLLF1 |
261093 : S49_Sppa_N_C |
|
5250 : hypothetical protein |
8240 : hypothetical protein |
16584 : PKc_like superfamily |
263053 : SEC14 |
|
6170 : hypothetical protein |
10835 : hypothetical protein |
22811 : hypothetical protein |
263118 : ABC_ATPase superfamily |
|
6645 : hypothetical protein |
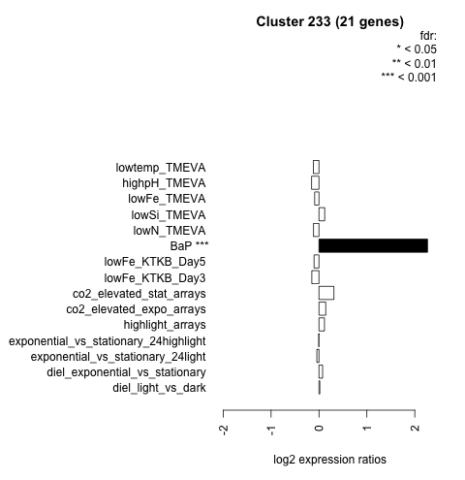
| Condition | Condition | Difference | FDR |
|---|---|---|---|
| diel_light_vs_dark | diel_light_vs_dark | 0.018 | 0.959 |
| lowFe_KTKB_Day3 | lowFe_KTKB_Day3 | -0.150 | 0.58 |
| lowFe_KTKB_Day5 | lowFe_KTKB_Day5 | -0.102 | 0.63 |
| BaP | BaP | 2.270 | 0.00037 |
| exponential_vs_stationary_24highlight | exponential_vs_stationary_24highlight | -0.007 | 0.967 |
| co2_elevated_stat_arrays | co2_elevated_stat_arrays | 0.311 | 0.152 |
| lowtemp_TMEVA | lowtemp_TMEVA | -0.117 | 0.673 |
| highpH_TMEVA | highpH_TMEVA | -0.155 | 0.341 |
| co2_elevated_expo_arrays | co2_elevated_expo_arrays | 0.142 | 0.464 |
| lowFe_TMEVA | lowFe_TMEVA | -0.090 | 0.823 |
| exponential_vs_stationary_24light | exponential_vs_stationary_24light | -0.044 | 0.905 |
| lowN_TMEVA | lowN_TMEVA | -0.115 | 0.761 |
| diel_exponential_vs_stationary | diel_exponential_vs_stationary | 0.075 | 0.723 |
| lowSi_TMEVA | lowSi_TMEVA | 0.120 | 0.976 |
| highlight_arrays | highlight_arrays | 0.114 | 0.497 |