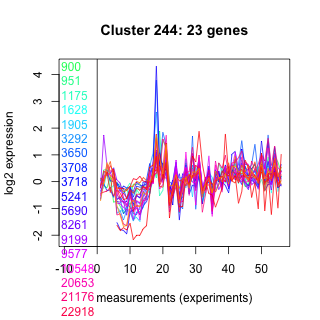
Thaps_hclust_0244 Hierarchical Clustering
Thalassiosira pseudonana
| Cluster Plot | Conditions Plot | Dendrogram |
|---|---|---|
 |
 |
 |
| GO ID | Go Term | p-value | q-value | Cluster |
|---|---|---|---|---|
| GO:0001682 | tRNA 5'-leader removal | 0.000413479 | 1 | Thaps_hclust_0244 |
| GO:0006118 | electron transport | 0.106972 | 1 | Thaps_hclust_0244 |
|
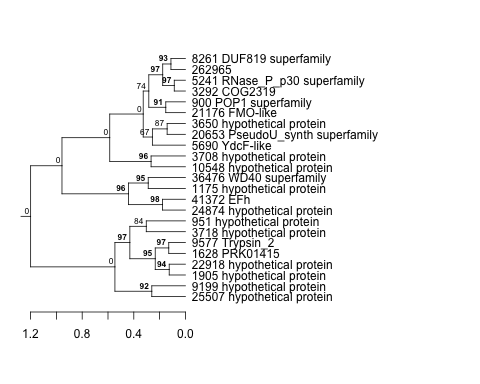
900 : POP1 superfamily |
3650 : hypothetical protein |
9199 : hypothetical protein |
24874 : hypothetical protein |
|
951 : hypothetical protein |
3708 : hypothetical protein |
9577 : Trypsin_2 |
25507 : hypothetical protein |
|
1175 : hypothetical protein |
3718 : hypothetical protein |
10548 : hypothetical protein |
36476 : WD40 superfamily |
|
1628 : PRK01415 |
5241 : RNase_P_p30 superfamily |
20653 : PseudoU_synth superfamily |
41372 : EFh |
|
1905 : hypothetical protein |
5690 : YdcF-like |
21176 : FMO-like |
262965 : |
|
3292 : COG2319 |
8261 : DUF819 superfamily |
22918 : hypothetical protein |
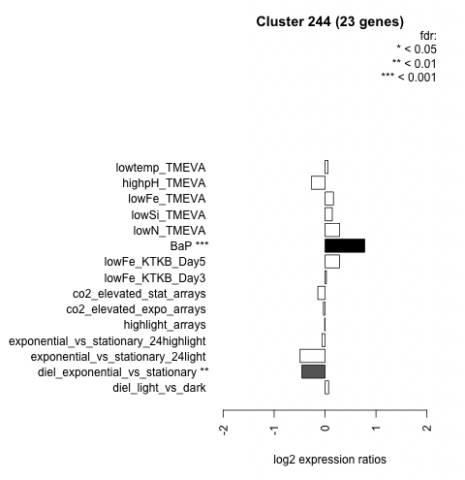
| Condition | Condition | Difference | FDR |
|---|---|---|---|
| diel_light_vs_dark | diel_light_vs_dark | 0.071 | 0.787 |
| lowFe_KTKB_Day3 | lowFe_KTKB_Day3 | 0.026 | 0.926 |
| lowFe_KTKB_Day5 | lowFe_KTKB_Day5 | 0.284 | 0.125 |
| BaP | BaP | 0.779 | 0.00037 |
| exponential_vs_stationary_24highlight | exponential_vs_stationary_24highlight | -0.060 | 0.587 |
| co2_elevated_stat_arrays | co2_elevated_stat_arrays | -0.142 | 0.574 |
| lowtemp_TMEVA | lowtemp_TMEVA | 0.057 | 0.844 |
| highpH_TMEVA | highpH_TMEVA | -0.269 | 0.0649 |
| co2_elevated_expo_arrays | co2_elevated_expo_arrays | -0.033 | 0.944 |
| lowFe_TMEVA | lowFe_TMEVA | 0.166 | 0.58 |
| exponential_vs_stationary_24light | exponential_vs_stationary_24light | -0.492 | 0.0894 |
| lowN_TMEVA | lowN_TMEVA | 0.286 | 0.382 |
| diel_exponential_vs_stationary | diel_exponential_vs_stationary | -0.455 | 0.00672 |
| lowSi_TMEVA | lowSi_TMEVA | 0.142 | 0.976 |
| highlight_arrays | highlight_arrays | -0.006 | 0.971 |