|
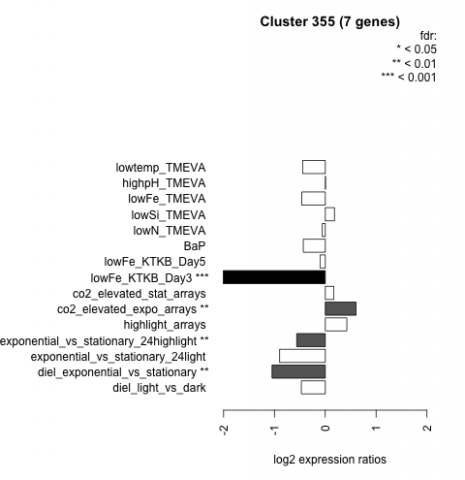
diel_light_vs_dark |
diel_light_vs_dark |
-0.470 |
0.176 |
|
lowFe_KTKB_Day3 |
lowFe_KTKB_Day3 |
-2.010 |
0.000862 |
|
lowFe_KTKB_Day5 |
lowFe_KTKB_Day5 |
-0.102 |
0.783 |
|
BaP |
BaP |
-0.432 |
0.239 |
|
exponential_vs_stationary_24highlight |
exponential_vs_stationary_24highlight |
-0.562 |
0.00248 |
|
co2_elevated_stat_arrays |
co2_elevated_stat_arrays |
0.168 |
0.625 |
|
lowtemp_TMEVA |
lowtemp_TMEVA |
-0.444 |
0.278 |
|
highpH_TMEVA |
highpH_TMEVA |
0.007 |
0.993 |
|
co2_elevated_expo_arrays |
co2_elevated_expo_arrays |
0.605 |
0.00488 |
|
lowFe_TMEVA |
lowFe_TMEVA |
-0.462 |
0.275 |
|
exponential_vs_stationary_24light |
exponential_vs_stationary_24light |
-0.899 |
0.0759 |
|
lowN_TMEVA |
lowN_TMEVA |
-0.059 |
0.885 |
|
diel_exponential_vs_stationary |
diel_exponential_vs_stationary |
-1.050 |
0.0016 |
|
lowSi_TMEVA |
lowSi_TMEVA |
0.181 |
0.913 |
|
highlight_arrays |
highlight_arrays |
0.425 |
0.0992 |