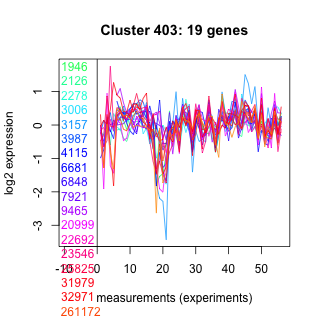
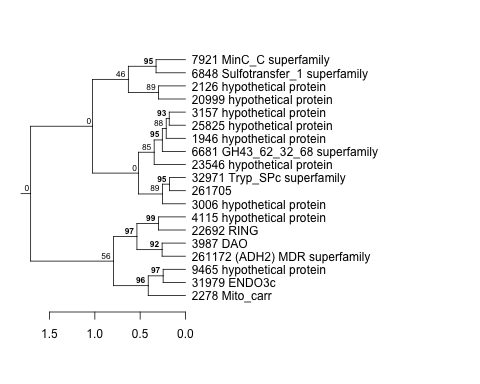
Thaps_hclust_0403 Hierarchical Clustering
Thalassiosira pseudonana
| Cluster Plot | Conditions Plot | Dendrogram |
|---|---|---|
 |
 |
 |
| GO ID | Go Term | p-value | q-value | Cluster |
|---|---|---|---|---|
| GO:0006284 | base-excision repair | 0.00618938 | 1 | Thaps_hclust_0403 |
| GO:0006810 | transport | 0.0133413 | 1 | Thaps_hclust_0403 |
| GO:0000074 | regulation of cell cycle | 0.0605266 | 1 | Thaps_hclust_0403 |
| GO:0016567 | protein ubiquitination | 0.0790695 | 1 | Thaps_hclust_0403 |
|
1946 : hypothetical protein |
3987 : DAO |
9465 : hypothetical protein |
31979 : ENDO3c |
|
2126 : hypothetical protein |
4115 : hypothetical protein |
20999 : hypothetical protein |
32971 : Tryp_SPc superfamily |
|
2278 : Mito_carr |
6681 : GH43_62_32_68 superfamily |
22692 : RING |
261172 : (ADH2) MDR superfamily |
|
3006 : hypothetical protein |
6848 : Sulfotransfer_1 superfamily |
23546 : hypothetical protein |
261705 : |
|
3157 : hypothetical protein |
7921 : MinC_C superfamily |
25825 : hypothetical protein |
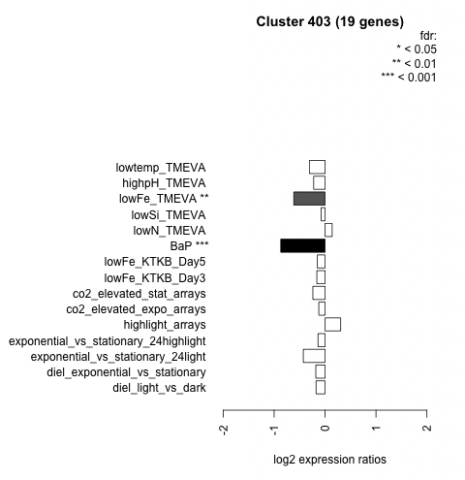
| Condition | Condition | Difference | FDR |
|---|---|---|---|
| diel_light_vs_dark | diel_light_vs_dark | -0.176 | 0.461 |
| lowFe_KTKB_Day3 | lowFe_KTKB_Day3 | -0.161 | 0.551 |
| lowFe_KTKB_Day5 | lowFe_KTKB_Day5 | -0.152 | 0.477 |
| BaP | BaP | -0.870 | 0.00037 |
| exponential_vs_stationary_24highlight | exponential_vs_stationary_24highlight | -0.137 | 0.219 |
| co2_elevated_stat_arrays | co2_elevated_stat_arrays | -0.240 | 0.316 |
| lowtemp_TMEVA | lowtemp_TMEVA | -0.308 | 0.25 |
| highpH_TMEVA | highpH_TMEVA | -0.224 | 0.174 |
| co2_elevated_expo_arrays | co2_elevated_expo_arrays | -0.123 | 0.597 |
| lowFe_TMEVA | lowFe_TMEVA | -0.614 | 0.00984 |
| exponential_vs_stationary_24light | exponential_vs_stationary_24light | -0.427 | 0.179 |
| lowN_TMEVA | lowN_TMEVA | 0.139 | 0.721 |
| diel_exponential_vs_stationary | diel_exponential_vs_stationary | -0.182 | 0.349 |
| lowSi_TMEVA | lowSi_TMEVA | -0.077 | 1 |
| highlight_arrays | highlight_arrays | 0.306 | 0.0505 |