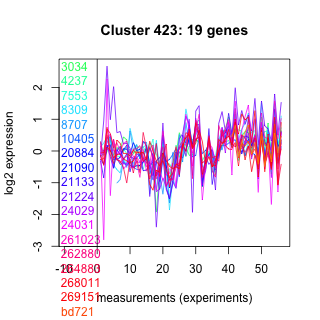
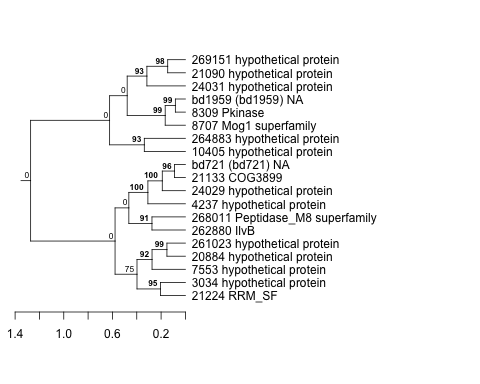
Thaps_hclust_0423 Hierarchical Clustering
Thalassiosira pseudonana
| Cluster Plot | Conditions Plot | Dendrogram |
|---|---|---|
 |
 |
 |
| GO ID | Go Term | p-value | q-value | Cluster |
|---|---|---|---|---|
| GO:0007155 | cell adhesion | 0.0184952 | 1 | Thaps_hclust_0423 |
| GO:0006468 | protein amino acid phosphorylation | 0.1264 | 1 | Thaps_hclust_0423 |
| GO:0006508 | proteolysis and peptidolysis | 0.168231 | 1 | Thaps_hclust_0423 |
|
3034 : hypothetical protein |
10405 : hypothetical protein |
24029 : hypothetical protein |
268011 : Peptidase_M8 superfamily |
|
4237 : hypothetical protein |
20884 : hypothetical protein |
24031 : hypothetical protein |
269151 : hypothetical protein |
|
7553 : hypothetical protein |
21090 : hypothetical protein |
261023 : hypothetical protein |
bd721 : (bd721) NA |
|
8309 : Pkinase |
21133 : COG3899 |
262880 : IlvB |
bd1959 : (bd1959) NA |
|
8707 : Mog1 superfamily |
21224 : RRM_SF |
264883 : hypothetical protein |
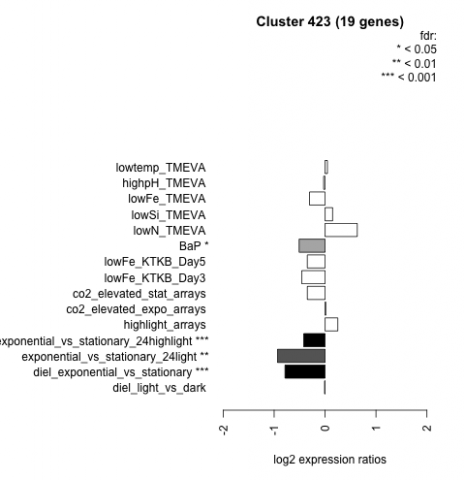
| Condition | Condition | Difference | FDR |
|---|---|---|---|
| diel_light_vs_dark | diel_light_vs_dark | -0.009 | 0.976 |
| lowFe_KTKB_Day3 | lowFe_KTKB_Day3 | -0.457 | 0.052 |
| lowFe_KTKB_Day5 | lowFe_KTKB_Day5 | -0.348 | 0.0901 |
| BaP | BaP | -0.510 | 0.0198 |
| exponential_vs_stationary_24highlight | exponential_vs_stationary_24highlight | -0.419 | 0.000526 |
| co2_elevated_stat_arrays | co2_elevated_stat_arrays | -0.348 | 0.122 |
| lowtemp_TMEVA | lowtemp_TMEVA | 0.046 | 0.884 |
| highpH_TMEVA | highpH_TMEVA | -0.028 | 0.913 |
| co2_elevated_expo_arrays | co2_elevated_expo_arrays | 0.016 | 0.985 |
| lowFe_TMEVA | lowFe_TMEVA | -0.305 | 0.285 |
| exponential_vs_stationary_24light | exponential_vs_stationary_24light | -0.935 | 0.00215 |
| lowN_TMEVA | lowN_TMEVA | 0.632 | 0.0522 |
| diel_exponential_vs_stationary | diel_exponential_vs_stationary | -0.786 | 0.000602 |
| lowSi_TMEVA | lowSi_TMEVA | 0.149 | 0.973 |
| highlight_arrays | highlight_arrays | 0.250 | 0.119 |