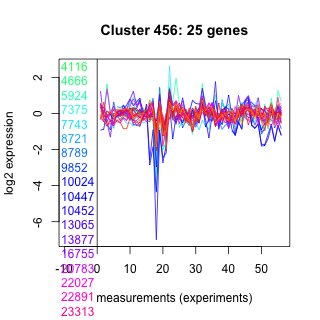
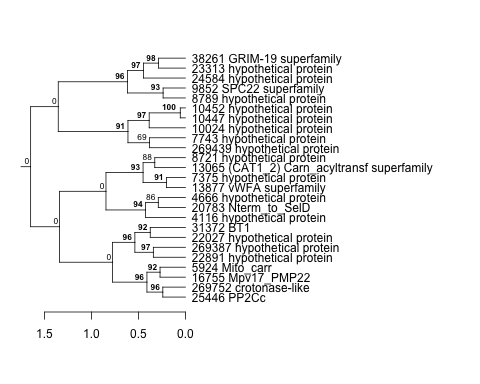
Thaps_hclust_0456 Hierarchical Clustering
Thalassiosira pseudonana
| Cluster Plot | Conditions Plot | Dendrogram |
|---|---|---|
 |
 |
 |
| GO ID | Go Term | p-value | q-value | Cluster |
|---|---|---|---|---|
| GO:0006465 | signal peptide processing | 0.00495406 | 1 | Thaps_hclust_0456 |
| GO:0006810 | transport | 0.0195143 | 1 | Thaps_hclust_0456 |
| GO:0006118 | electron transport | 0.287914 | 1 | Thaps_hclust_0456 |
| GO:0006355 | regulation of transcription, DNA-dependent | 0.325408 | 1 | Thaps_hclust_0456 |
| GO:0008152 | metabolism | 0.410014 | 1 | Thaps_hclust_0456 |
|
4116 : hypothetical protein |
9852 : SPC22 superfamily |
16755 : Mpv17_PMP22 |
25446 : PP2Cc |
|
4666 : hypothetical protein |
10024 : hypothetical protein |
20783 : Nterm_to_SelD |
31372 : BT1 |
|
5924 : Mito_carr |
10447 : hypothetical protein |
22027 : hypothetical protein |
38261 : GRIM-19 superfamily |
|
7375 : hypothetical protein |
10452 : hypothetical protein |
22891 : hypothetical protein |
269387 : hypothetical protein |
|
7743 : hypothetical protein |
13065 : (CAT1_2) Carn_acyltransf superfamily |
23313 : hypothetical protein |
269439 : hypothetical protein |
|
8721 : hypothetical protein |
13877 : vWFA superfamily |
24584 : hypothetical protein |
269752 : crotonase-like |
|
8789 : hypothetical protein |
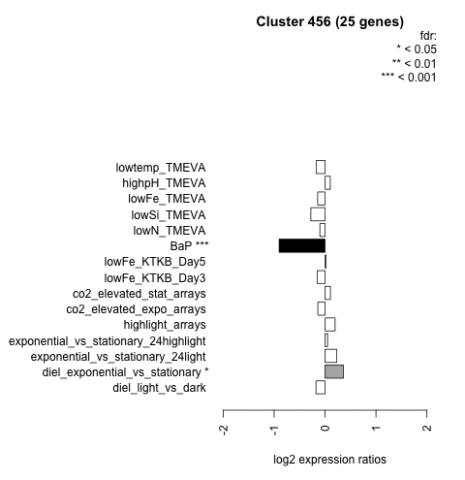
| Condition | Condition | Difference | FDR |
|---|---|---|---|
| diel_light_vs_dark | diel_light_vs_dark | -0.178 | 0.385 |
| lowFe_KTKB_Day3 | lowFe_KTKB_Day3 | -0.152 | 0.526 |
| lowFe_KTKB_Day5 | lowFe_KTKB_Day5 | 0.018 | 0.937 |
| BaP | BaP | -0.902 | 0.00037 |
| exponential_vs_stationary_24highlight | exponential_vs_stationary_24highlight | 0.049 | 0.634 |
| co2_elevated_stat_arrays | co2_elevated_stat_arrays | 0.106 | 0.695 |
| lowtemp_TMEVA | lowtemp_TMEVA | -0.173 | 0.456 |
| highpH_TMEVA | highpH_TMEVA | 0.101 | 0.517 |
| co2_elevated_expo_arrays | co2_elevated_expo_arrays | -0.141 | 0.441 |
| lowFe_TMEVA | lowFe_TMEVA | -0.146 | 0.63 |
| exponential_vs_stationary_24light | exponential_vs_stationary_24light | 0.229 | 0.474 |
| lowN_TMEVA | lowN_TMEVA | -0.101 | 0.789 |
| diel_exponential_vs_stationary | diel_exponential_vs_stationary | 0.362 | 0.0156 |
| lowSi_TMEVA | lowSi_TMEVA | -0.280 | 0.719 |
| highlight_arrays | highlight_arrays | 0.196 | 0.169 |