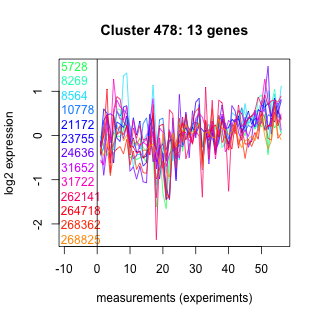
Thaps_hclust_0478 Hierarchical Clustering
Thalassiosira pseudonana
| Cluster Plot | Conditions Plot | Dendrogram |
|---|---|---|
 |
 |
 |
| GO ID | Go Term | p-value | q-value | Cluster |
|---|---|---|---|---|
| GO:0006355 | regulation of transcription, DNA-dependent | 0.0000757 | 0.273829 | Thaps_hclust_0478 |
| GO:0007049 | cell cycle | 0.00721795 | 1 | Thaps_hclust_0478 |
|
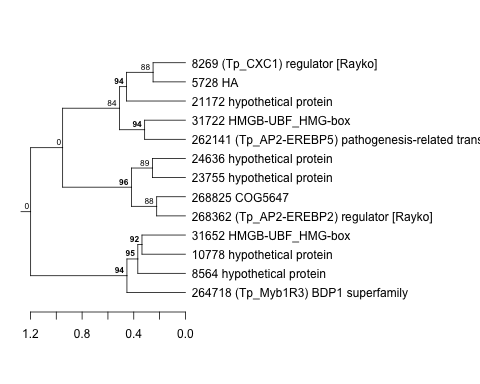
5728 : HA |
21172 : hypothetical protein |
31652 : HMGB-UBF_HMG-box |
264718 : (Tp_Myb1R3) BDP1 superfamily |
|
8269 : (Tp_CXC1) regulator [Rayko] |
23755 : hypothetical protein |
31722 : HMGB-UBF_HMG-box |
268362 : (Tp_AP2-EREBP2) regulator [Rayko] |
|
8564 : hypothetical protein |
24636 : hypothetical protein |
262141 : (Tp_AP2-EREBP5) pathogenesis-related transcription factor |
268825 : COG5647 |
|
10778 : hypothetical protein |
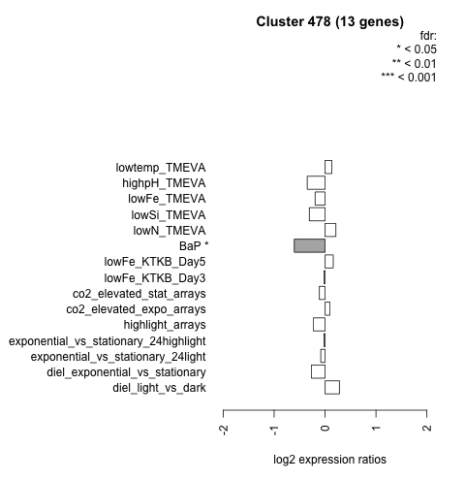
| Condition | Condition | Difference | FDR |
|---|---|---|---|
| diel_light_vs_dark | diel_light_vs_dark | 0.283 | 0.288 |
| lowFe_KTKB_Day3 | lowFe_KTKB_Day3 | -0.021 | 0.954 |
| lowFe_KTKB_Day5 | lowFe_KTKB_Day5 | 0.161 | 0.552 |
| BaP | BaP | -0.605 | 0.0213 |
| exponential_vs_stationary_24highlight | exponential_vs_stationary_24highlight | -0.020 | 0.902 |
| co2_elevated_stat_arrays | co2_elevated_stat_arrays | -0.113 | 0.697 |
| lowtemp_TMEVA | lowtemp_TMEVA | 0.133 | 0.695 |
| highpH_TMEVA | highpH_TMEVA | -0.350 | 0.0723 |
| co2_elevated_expo_arrays | co2_elevated_expo_arrays | 0.096 | 0.786 |
| lowFe_TMEVA | lowFe_TMEVA | -0.194 | 0.58 |
| exponential_vs_stationary_24light | exponential_vs_stationary_24light | -0.084 | 0.862 |
| lowN_TMEVA | lowN_TMEVA | 0.212 | 0.607 |
| diel_exponential_vs_stationary | diel_exponential_vs_stationary | -0.269 | 0.241 |
| lowSi_TMEVA | lowSi_TMEVA | -0.308 | 0.707 |
| highlight_arrays | highlight_arrays | -0.231 | 0.241 |