Hierarchical Clusters
Displaying 501 - 600 of 28001
| Title | Cluster Plot | Dendrogram | e-value | e-value | e-value | Condition | Condition FDR | Condition Difference |
|---|---|---|---|---|---|---|---|---|
| Thaps_hclust_0336 |
 |
 |
8.7e-23 |
0.00000000000015 |
0.0000000000000032 |
lowSi_TMEVA | 0.983000 | 0.102 |
| Thaps_hclust_0336 |
|
|
8.7e-23 |
0.00000000000015 |
0.0000000000000032 |
highlight_arrays | 0.276000 | -0.234 |
| Title | Cluster Plot | Dendrogram | e-value | e-value | e-value | Condition | Condition FDR | Condition Difference |
|---|---|---|---|---|---|---|---|---|
| Thaps_hclust_0028 |
 |
|
1.6e-27 |
6.8e-18 |
0.0000000000000078 |
diel_light_vs_dark | 0.000485 | 0.467 |
| Thaps_hclust_0028 |
|
|
1.6e-27 |
6.8e-18 |
0.0000000000000078 |
lowFe_KTKB_Day3 | 0.859000 | -0.0308 |
| Thaps_hclust_0028 |
|
|
1.6e-27 |
6.8e-18 |
0.0000000000000078 |
lowFe_KTKB_Day5 | 0.908000 | 0.0157 |
| Thaps_hclust_0028 |
|
|
1.6e-27 |
6.8e-18 |
0.0000000000000078 |
BaP | 0.080000 | -0.197 |
| Thaps_hclust_0028 |
|
|
1.6e-27 |
6.8e-18 |
0.0000000000000078 |
exponential_vs_stationary_24highlight | 0.000526 | 0.591 |
| Thaps_hclust_0028 |
|
|
1.6e-27 |
6.8e-18 |
0.0000000000000078 |
co2_elevated_stat_arrays | 0.001190 | -0.393 |
| Thaps_hclust_0028 |
|
|
1.6e-27 |
6.8e-18 |
0.0000000000000078 |
lowtemp_TMEVA | 0.061100 | -0.254 |
| Thaps_hclust_0028 |
|
|
1.6e-27 |
6.8e-18 |
0.0000000000000078 |
highpH_TMEVA | 0.112000 | -0.152 |
| Thaps_hclust_0028 |
|
|
1.6e-27 |
6.8e-18 |
0.0000000000000078 |
co2_elevated_expo_arrays | 1.000000 | 0.00454 |
| Thaps_hclust_0028 |
|
|
1.6e-27 |
6.8e-18 |
0.0000000000000078 |
lowFe_TMEVA | 0.001040 | -0.401 |
| Thaps_hclust_0028 |
|
|
1.6e-27 |
6.8e-18 |
0.0000000000000078 |
exponential_vs_stationary_24light | 0.000581 | 1.51 |
| Thaps_hclust_0028 |
|
|
1.6e-27 |
6.8e-18 |
0.0000000000000078 |
lowN_TMEVA | 0.001190 | -0.933 |
| Thaps_hclust_0028 |
|
|
1.6e-27 |
6.8e-18 |
0.0000000000000078 |
diel_exponential_vs_stationary | 0.000602 | 0.543 |
| Thaps_hclust_0028 |
|
|
1.6e-27 |
6.8e-18 |
0.0000000000000078 |
lowSi_TMEVA | 0.001350 | -0.821 |
| Thaps_hclust_0028 |
|
|
1.6e-27 |
6.8e-18 |
0.0000000000000078 |
highlight_arrays | 0.000442 | -0.441 |
| Title | Cluster Plot | Dendrogram | e-value | e-value | e-value | Condition | Condition FDR | Condition Difference |
|---|---|---|---|---|---|---|---|---|
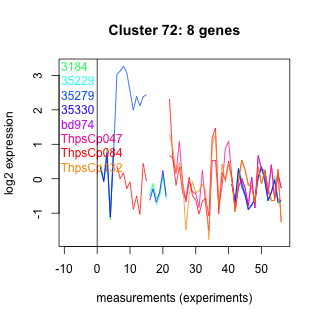
| Thaps_hclust_0072 |
 |
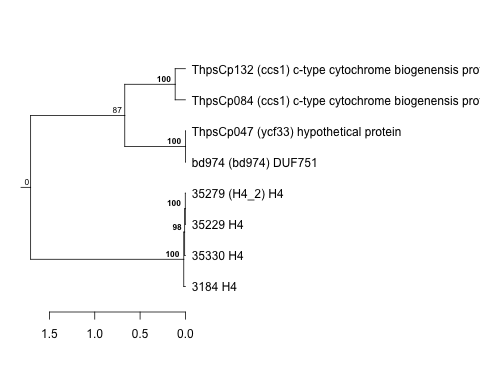 |
1.2e-22 |
1.1e-16 |
0.000000000000011 |
diel_light_vs_dark | 0.629000 | -0.188 |
| Thaps_hclust_0072 |
|
|
1.2e-22 |
1.1e-16 |
0.000000000000011 |
lowFe_KTKB_Day3 | 0.157000 | -0.534 |
| Thaps_hclust_0072 |
|
|
1.2e-22 |
1.1e-16 |
0.000000000000011 |
lowFe_KTKB_Day5 | 0.501000 | -0.218 |
| Thaps_hclust_0072 |
|
|
1.2e-22 |
1.1e-16 |
0.000000000000011 |
BaP | 0.284000 | -0.374 |
| Thaps_hclust_0072 |
|
|
1.2e-22 |
1.1e-16 |
0.000000000000011 |
exponential_vs_stationary_24highlight | 0.035600 | 0.354 |
| Thaps_hclust_0072 |
|
|
1.2e-22 |
1.1e-16 |
0.000000000000011 |
co2_elevated_stat_arrays | 0.848000 | -0.0679 |
| Thaps_hclust_0072 |
|
|
1.2e-22 |
1.1e-16 |
0.000000000000011 |
lowtemp_TMEVA | 0.044600 | 0.856 |
| Thaps_hclust_0072 |
|
|
1.2e-22 |
1.1e-16 |
0.000000000000011 |
highpH_TMEVA | 0.131000 | 0.364 |
| Thaps_hclust_0072 |
|
|
1.2e-22 |
1.1e-16 |
0.000000000000011 |
co2_elevated_expo_arrays | 0.943000 | -0.0434 |
| Thaps_hclust_0072 |
|
|
1.2e-22 |
1.1e-16 |
0.000000000000011 |
lowFe_TMEVA | 0.899000 | -0.0587 |
| Thaps_hclust_0072 |
|
|
1.2e-22 |
1.1e-16 |
0.000000000000011 |
exponential_vs_stationary_24light | 0.547000 | 0.307 |
| Thaps_hclust_0072 |
|
|
1.2e-22 |
1.1e-16 |
0.000000000000011 |
lowN_TMEVA | 0.120000 | 0.766 |
| Thaps_hclust_0072 |
|
|
1.2e-22 |
1.1e-16 |
0.000000000000011 |
diel_exponential_vs_stationary | 0.079000 | 0.513 |
| Thaps_hclust_0072 |
|
|
1.2e-22 |
1.1e-16 |
0.000000000000011 |
lowSi_TMEVA | 0.051200 | -1.14 |
| Thaps_hclust_0072 |
|
|
1.2e-22 |
1.1e-16 |
0.000000000000011 |
highlight_arrays | 0.502000 | -0.173 |
| Title | Cluster Plot | Dendrogram | e-value | e-value | e-value | Condition | Condition FDR | Condition Difference |
|---|---|---|---|---|---|---|---|---|
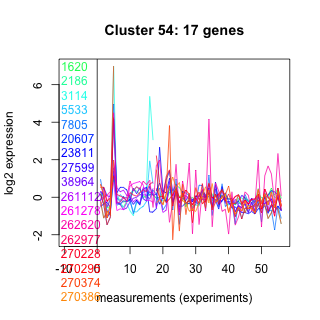
| Thaps_hclust_0054 |
 |
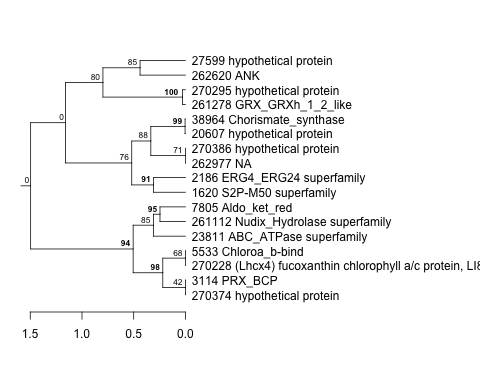 |
1.6e-17 |
0.0000000000053 |
0.000000000000024 |
diel_light_vs_dark | 0.016000 | -0.509 |
| Thaps_hclust_0054 |
|
|
1.6e-17 |
0.0000000000053 |
0.000000000000024 |
lowFe_KTKB_Day3 | 0.001610 | 0.767 |
| Thaps_hclust_0054 |
|
|
1.6e-17 |
0.0000000000053 |
0.000000000000024 |
lowFe_KTKB_Day5 | 0.088000 | 0.367 |
| Thaps_hclust_0054 |
|
|
1.6e-17 |
0.0000000000053 |
0.000000000000024 |
BaP | 0.386000 | 0.215 |
| Thaps_hclust_0054 |
|
|
1.6e-17 |
0.0000000000053 |
0.000000000000024 |
exponential_vs_stationary_24highlight | 0.043700 | 0.228 |
| Thaps_hclust_0054 |
|
|
1.6e-17 |
0.0000000000053 |
0.000000000000024 |
co2_elevated_stat_arrays | 0.856000 | 0.0533 |
| Thaps_hclust_0054 |
|
|
1.6e-17 |
0.0000000000053 |
0.000000000000024 |
lowtemp_TMEVA | 0.000735 | 2.95 |
| Thaps_hclust_0054 |
|
|
1.6e-17 |
0.0000000000053 |
0.000000000000024 |
highpH_TMEVA | 0.358000 | 0.161 |
| Thaps_hclust_0054 |
|
|
1.6e-17 |
0.0000000000053 |
0.000000000000024 |
co2_elevated_expo_arrays | 0.985000 | 0.00824 |
| Thaps_hclust_0054 |
|
|
1.6e-17 |
0.0000000000053 |
0.000000000000024 |
lowFe_TMEVA | 0.813000 | -0.098 |
| Thaps_hclust_0054 |
|
|
1.6e-17 |
0.0000000000053 |
0.000000000000024 |
exponential_vs_stationary_24light | 0.084300 | 0.572 |
| Thaps_hclust_0054 |
|
|
1.6e-17 |
0.0000000000053 |
0.000000000000024 |
lowN_TMEVA | 0.051700 | -0.675 |
| Thaps_hclust_0054 |
|
|
1.6e-17 |
0.0000000000053 |
0.000000000000024 |
diel_exponential_vs_stationary | 0.097200 | 0.318 |
| Thaps_hclust_0054 |
|
|
1.6e-17 |
0.0000000000053 |
0.000000000000024 |
lowSi_TMEVA | 0.372000 | -0.487 |
| Thaps_hclust_0054 |
|
|
1.6e-17 |
0.0000000000053 |
0.000000000000024 |
highlight_arrays | 0.244000 | -0.202 |
| Title | Cluster Plot | Dendrogram | e-value | e-value | e-value | Condition | Condition FDR | Condition Difference |
|---|---|---|---|---|---|---|---|---|
| Thaps_hclust_0099 |
 |
 |
0.0000000000000032 |
0.000000000000013 |
0.000000000000025 |
diel_light_vs_dark | 0.152000 | -0.59 |
| Thaps_hclust_0099 |
|
|
0.0000000000000032 |
0.000000000000013 |
0.000000000000025 |
lowFe_KTKB_Day3 | 0.887000 | 0.0802 |
| Thaps_hclust_0099 |
|
|
0.0000000000000032 |
0.000000000000013 |
0.000000000000025 |
lowFe_KTKB_Day5 | 0.284000 | -0.427 |
| Thaps_hclust_0099 |
|
|
0.0000000000000032 |
0.000000000000013 |
0.000000000000025 |
BaP | 0.183000 | -0.581 |
| Thaps_hclust_0099 |
|
|
0.0000000000000032 |
0.000000000000013 |
0.000000000000025 |
exponential_vs_stationary_24highlight | 0.000526 | 0.919 |
| Thaps_hclust_0099 |
|
|
0.0000000000000032 |
0.000000000000013 |
0.000000000000025 |
co2_elevated_stat_arrays | 0.070300 | 0.686 |
| Thaps_hclust_0099 |
|
|
0.0000000000000032 |
0.000000000000013 |
0.000000000000025 |
lowtemp_TMEVA | 0.020700 | -1.41 |
| Thaps_hclust_0099 |
|
|
0.0000000000000032 |
0.000000000000013 |
0.000000000000025 |
highpH_TMEVA | 0.053300 | 0.615 |
| Thaps_hclust_0099 |
|
|
0.0000000000000032 |
0.000000000000013 |
0.000000000000025 |
co2_elevated_expo_arrays | 1.000000 | -0.00337 |
| Thaps_hclust_0099 |
|
|
0.0000000000000032 |
0.000000000000013 |
0.000000000000025 |
lowFe_TMEVA | 0.216000 | -0.629 |
| Thaps_hclust_0099 |
|
|
0.0000000000000032 |
0.000000000000013 |
0.000000000000025 |
exponential_vs_stationary_24light | 0.055600 | 1.17 |
| Thaps_hclust_0099 |
|
|
0.0000000000000032 |
0.000000000000013 |
0.000000000000025 |
lowN_TMEVA | 0.027400 | -1.48 |
| Thaps_hclust_0099 |
|
|
0.0000000000000032 |
0.000000000000013 |
0.000000000000025 |
diel_exponential_vs_stationary | 0.837000 | 0.0789 |
| Thaps_hclust_0099 |
|
|
0.0000000000000032 |
0.000000000000013 |
0.000000000000025 |
lowSi_TMEVA | 0.021200 | -1.72 |
| Thaps_hclust_0099 |
|
|
0.0000000000000032 |
0.000000000000013 |
0.000000000000025 |
highlight_arrays | 0.036900 | 0.656 |
| Title | Cluster Plot | Dendrogram | e-value | e-value | e-value | Condition | Condition FDR | Condition Difference |
|---|---|---|---|---|---|---|---|---|
| Thaps_hclust_0017 |
 |
 |
4.6e-24 |
0.00000000000046 |
0.000000000000098 |
diel_light_vs_dark | 0.000485 | -0.939 |
| Thaps_hclust_0017 |
|
|
4.6e-24 |
0.00000000000046 |
0.000000000000098 |
lowFe_KTKB_Day3 | 0.000862 | 1.67 |
| Thaps_hclust_0017 |
|
|
4.6e-24 |
0.00000000000046 |
0.000000000000098 |
lowFe_KTKB_Day5 | 0.001320 | 0.772 |
| Thaps_hclust_0017 |
|
|
4.6e-24 |
0.00000000000046 |
0.000000000000098 |
BaP | 0.022800 | -0.302 |
| Thaps_hclust_0017 |
|
|
4.6e-24 |
0.00000000000046 |
0.000000000000098 |
exponential_vs_stationary_24highlight | 0.000526 | 0.31 |
| Thaps_hclust_0017 |
|
|
4.6e-24 |
0.00000000000046 |
0.000000000000098 |
co2_elevated_stat_arrays | 0.064400 | 0.292 |
| Thaps_hclust_0017 |
|
|
4.6e-24 |
0.00000000000046 |
0.000000000000098 |
lowtemp_TMEVA | 0.297000 | 0.177 |
| Thaps_hclust_0017 |
|
|
4.6e-24 |
0.00000000000046 |
0.000000000000098 |
highpH_TMEVA | 0.851000 | -0.0286 |
| Thaps_hclust_0017 |
|
|
4.6e-24 |
0.00000000000046 |
0.000000000000098 |
co2_elevated_expo_arrays | 0.025000 | 0.206 |
| Thaps_hclust_0017 |
|
|
4.6e-24 |
0.00000000000046 |
0.000000000000098 |
lowFe_TMEVA | 0.001040 | -0.751 |
| Thaps_hclust_0017 |
|
|
4.6e-24 |
0.00000000000046 |
0.000000000000098 |
exponential_vs_stationary_24light | 0.000581 | 1.74 |
| Thaps_hclust_0017 |
|
|
4.6e-24 |
0.00000000000046 |
0.000000000000098 |
lowN_TMEVA | 0.001190 | -0.978 |
| Thaps_hclust_0017 |
|
|
4.6e-24 |
0.00000000000046 |
0.000000000000098 |
diel_exponential_vs_stationary | 0.000602 | 1.06 |
| Thaps_hclust_0017 |
|
|
4.6e-24 |
0.00000000000046 |
0.000000000000098 |
lowSi_TMEVA | 0.001350 | -1.05 |
| Thaps_hclust_0017 |
|
|
4.6e-24 |
0.00000000000046 |
0.000000000000098 |
highlight_arrays | 0.000442 | -0.678 |
| Title | Cluster Plot | Dendrogram | e-value | e-value | e-value | Condition | Condition FDR | Condition Difference |
|---|---|---|---|---|---|---|---|---|
| Thaps_hclust_0024 |
 |
|
2.8e-19 |
1.2e-20 |
0.00000000000043 |
diel_light_vs_dark | 0.000485 | -0.457 |
| Thaps_hclust_0024 |
|
|
2.8e-19 |
1.2e-20 |
0.00000000000043 |
lowFe_KTKB_Day3 | 0.000862 | 1.17 |
| Thaps_hclust_0024 |
|
|
2.8e-19 |
1.2e-20 |
0.00000000000043 |
lowFe_KTKB_Day5 | 0.358000 | 0.101 |
| Thaps_hclust_0024 |
|
|
2.8e-19 |
1.2e-20 |
0.00000000000043 |
BaP | 0.057600 | -0.21 |
| Thaps_hclust_0024 |
|
|
2.8e-19 |
1.2e-20 |
0.00000000000043 |
exponential_vs_stationary_24highlight | 0.000526 | 0.184 |
| Thaps_hclust_0024 |
|
|
2.8e-19 |
1.2e-20 |
0.00000000000043 |
co2_elevated_stat_arrays | 0.002130 | 0.376 |
| Thaps_hclust_0024 |
|
|
2.8e-19 |
1.2e-20 |
0.00000000000043 |
lowtemp_TMEVA | 0.000735 | -0.991 |
| Thaps_hclust_0024 |
|
|
2.8e-19 |
1.2e-20 |
0.00000000000043 |
highpH_TMEVA | 0.008490 | -0.223 |
| Thaps_hclust_0024 |
|
|
2.8e-19 |
1.2e-20 |
0.00000000000043 |
co2_elevated_expo_arrays | 0.934000 | -0.0451 |
| Thaps_hclust_0024 |
|
|
2.8e-19 |
1.2e-20 |
0.00000000000043 |
lowFe_TMEVA | 0.001040 | -1.22 |
| Thaps_hclust_0024 |
|
|
2.8e-19 |
1.2e-20 |
0.00000000000043 |
exponential_vs_stationary_24light | 0.000581 | 2.13 |
| Thaps_hclust_0024 |
|
|
2.8e-19 |
1.2e-20 |
0.00000000000043 |
lowN_TMEVA | 0.001190 | -1.66 |
| Thaps_hclust_0024 |
|
|
2.8e-19 |
1.2e-20 |
0.00000000000043 |
diel_exponential_vs_stationary | 0.000602 | 1.69 |
| Thaps_hclust_0024 |
|
|
2.8e-19 |
1.2e-20 |
0.00000000000043 |
lowSi_TMEVA | 0.001350 | -2.07 |
| Thaps_hclust_0024 |
|
|
2.8e-19 |
1.2e-20 |
0.00000000000043 |
highlight_arrays | 0.000442 | -0.785 |
| Title | Cluster Plot | Dendrogram | e-value | e-value | e-value | Condition | Condition FDR | Condition Difference |
|---|---|---|---|---|---|---|---|---|
| Thaps_hclust_0221 |
 |
|
|
1e-37 |
0.0000000000012 |
diel_light_vs_dark | 0.000485 | -0.454 |
| Thaps_hclust_0221 |
|
|
|
1e-37 |
0.0000000000012 |
lowFe_KTKB_Day3 | 0.000862 | 0.52 |
| Thaps_hclust_0221 |
|
|
|
1e-37 |
0.0000000000012 |
lowFe_KTKB_Day5 | 0.096600 | 0.159 |
| Thaps_hclust_0221 |
|
|
|
1e-37 |
0.0000000000012 |
BaP | 0.000370 | 0.761 |
| Thaps_hclust_0221 |
|
|
|
1e-37 |
0.0000000000012 |
exponential_vs_stationary_24highlight | 0.034900 | -0.103 |
| Thaps_hclust_0221 |
|
|
|
1e-37 |
0.0000000000012 |
co2_elevated_stat_arrays | 0.000658 | 1.14 |
| Thaps_hclust_0221 |
|
|
|
1e-37 |
0.0000000000012 |
lowtemp_TMEVA | 0.000735 | 1.13 |
| Thaps_hclust_0221 |
|
|
|
1e-37 |
0.0000000000012 |
highpH_TMEVA | 0.001370 | -0.241 |