Hierarchical Clusters
Displaying 501 - 600 of 28001
| Title | Cluster Plot | Dendrogram | e-value | e-value | e-value | Condition | Condition FDR | Condition Difference |
|---|---|---|---|---|---|---|---|---|
| Thaps_hclust_0024 |
 |
|
2.8e-19 |
1.2e-20 |
0.00000000000043 |
lowSi_TMEVA | 0.001350 | -2.07 |
| Thaps_hclust_0024 |
|
|
2.8e-19 |
1.2e-20 |
0.00000000000043 |
highlight_arrays | 0.000442 | -0.785 |
| Title | Cluster Plot | Dendrogram | e-value | e-value | e-value | Condition | Condition FDR | Condition Difference |
|---|---|---|---|---|---|---|---|---|
| Thaps_hclust_0092 |
 |
|
1.3e-37 |
4.2e-20 |
0.0000000000000013 |
diel_light_vs_dark | 0.000485 | 1.49 |
| Thaps_hclust_0092 |
|
|
1.3e-37 |
4.2e-20 |
0.0000000000000013 |
lowFe_KTKB_Day3 | 0.000862 | 0.577 |
| Thaps_hclust_0092 |
|
|
1.3e-37 |
4.2e-20 |
0.0000000000000013 |
lowFe_KTKB_Day5 | 0.001320 | 0.343 |
| Thaps_hclust_0092 |
|
|
1.3e-37 |
4.2e-20 |
0.0000000000000013 |
BaP | 0.537000 | -0.0686 |
| Thaps_hclust_0092 |
|
|
1.3e-37 |
4.2e-20 |
0.0000000000000013 |
exponential_vs_stationary_24highlight | 0.722000 | -0.0199 |
| Thaps_hclust_0092 |
|
|
1.3e-37 |
4.2e-20 |
0.0000000000000013 |
co2_elevated_stat_arrays | 0.000658 | 1.24 |
| Thaps_hclust_0092 |
|
|
1.3e-37 |
4.2e-20 |
0.0000000000000013 |
lowtemp_TMEVA | 0.038100 | -0.246 |
| Thaps_hclust_0092 |
|
|
1.3e-37 |
4.2e-20 |
0.0000000000000013 |
highpH_TMEVA | 0.000725 | -0.895 |
| Thaps_hclust_0092 |
|
|
1.3e-37 |
4.2e-20 |
0.0000000000000013 |
co2_elevated_expo_arrays | 0.001390 | 1.11 |
| Thaps_hclust_0092 |
|
|
1.3e-37 |
4.2e-20 |
0.0000000000000013 |
lowFe_TMEVA | 0.766000 | 0.0993 |
| Thaps_hclust_0092 |
|
|
1.3e-37 |
4.2e-20 |
0.0000000000000013 |
exponential_vs_stationary_24light | 0.000581 | 1.99 |
| Thaps_hclust_0092 |
|
|
1.3e-37 |
4.2e-20 |
0.0000000000000013 |
lowN_TMEVA | 0.001190 | -0.464 |
| Thaps_hclust_0092 |
|
|
1.3e-37 |
4.2e-20 |
0.0000000000000013 |
diel_exponential_vs_stationary | 0.043600 | 0.159 |
| Thaps_hclust_0092 |
|
|
1.3e-37 |
4.2e-20 |
0.0000000000000013 |
lowSi_TMEVA | 0.001350 | -1.05 |
| Thaps_hclust_0092 |
|
|
1.3e-37 |
4.2e-20 |
0.0000000000000013 |
highlight_arrays | 0.000442 | -0.346 |
| Title | Cluster Plot | Dendrogram | e-value | e-value | e-value | Condition | Condition FDR | Condition Difference |
|---|---|---|---|---|---|---|---|---|
| Thaps_hclust_0220 |
 |
|
|
2.4e-19 |
3.2e-19 |
diel_light_vs_dark | 0.000485 | -0.512 |
| Thaps_hclust_0220 |
|
|
|
2.4e-19 |
3.2e-19 |
lowFe_KTKB_Day3 | 0.777000 | 0.0428 |
| Thaps_hclust_0220 |
|
|
|
2.4e-19 |
3.2e-19 |
lowFe_KTKB_Day5 | 0.003410 | -0.255 |
| Thaps_hclust_0220 |
|
|
|
2.4e-19 |
3.2e-19 |
BaP | 0.000370 | 0.829 |
| Thaps_hclust_0220 |
|
|
|
2.4e-19 |
3.2e-19 |
exponential_vs_stationary_24highlight | 0.001710 | -0.142 |
| Thaps_hclust_0220 |
|
|
|
2.4e-19 |
3.2e-19 |
co2_elevated_stat_arrays | 0.000658 | 1.29 |
| Thaps_hclust_0220 |
|
|
|
2.4e-19 |
3.2e-19 |
lowtemp_TMEVA | 0.000735 | 0.902 |
| Thaps_hclust_0220 |
|
|
|
2.4e-19 |
3.2e-19 |
highpH_TMEVA | 0.000725 | -0.278 |
| Thaps_hclust_0220 |
|
|
|
2.4e-19 |
3.2e-19 |
co2_elevated_expo_arrays | 0.021800 | -0.173 |
| Thaps_hclust_0220 |
|
|
|
2.4e-19 |
3.2e-19 |
lowFe_TMEVA | 0.452000 | -0.154 |
| Thaps_hclust_0220 |
|
|
|
2.4e-19 |
3.2e-19 |
exponential_vs_stationary_24light | 0.000581 | -1.02 |
| Thaps_hclust_0220 |
|
|
|
2.4e-19 |
3.2e-19 |
lowN_TMEVA | 0.001190 | 0.851 |
| Thaps_hclust_0220 |
|
|
|
2.4e-19 |
3.2e-19 |
diel_exponential_vs_stationary | 0.000602 | -0.271 |
| Thaps_hclust_0220 |
|
|
|
2.4e-19 |
3.2e-19 |
lowSi_TMEVA | 1.000000 | 0.0311 |
| Thaps_hclust_0220 |
|
|
|
2.4e-19 |
3.2e-19 |
highlight_arrays | 0.000442 | 0.336 |
| Title | Cluster Plot | Dendrogram | e-value | e-value | e-value | Condition | Condition FDR | Condition Difference |
|---|---|---|---|---|---|---|---|---|
| Thaps_hclust_0052 |
 |
 |
1.4e-22 |
3.3e-19 |
0.0000000000037 |
diel_light_vs_dark | 0.000926 | -0.449 |
| Thaps_hclust_0052 |
|
|
1.4e-22 |
3.3e-19 |
0.0000000000037 |
lowFe_KTKB_Day3 | 0.002990 | 0.429 |
| Thaps_hclust_0052 |
|
|
1.4e-22 |
3.3e-19 |
0.0000000000037 |
lowFe_KTKB_Day5 | 0.017400 | 0.307 |
| Thaps_hclust_0052 |
|
|
1.4e-22 |
3.3e-19 |
0.0000000000037 |
BaP | 0.000370 | 0.974 |
| Thaps_hclust_0052 |
|
|
1.4e-22 |
3.3e-19 |
0.0000000000037 |
exponential_vs_stationary_24highlight | 0.000526 | 0.247 |
| Thaps_hclust_0052 |
|
|
1.4e-22 |
3.3e-19 |
0.0000000000037 |
co2_elevated_stat_arrays | 0.048700 | 0.324 |
| Thaps_hclust_0052 |
|
|
1.4e-22 |
3.3e-19 |
0.0000000000037 |
lowtemp_TMEVA | 0.000735 | 0.661 |
| Thaps_hclust_0052 |
|
|
1.4e-22 |
3.3e-19 |
0.0000000000037 |
highpH_TMEVA | 0.021700 | 0.257 |
| Thaps_hclust_0052 |
|
|
1.4e-22 |
3.3e-19 |
0.0000000000037 |
co2_elevated_expo_arrays | 1.000000 | 0.00058 |
| Thaps_hclust_0052 |
|
|
1.4e-22 |
3.3e-19 |
0.0000000000037 |
lowFe_TMEVA | 0.911000 | -0.0426 |
| Thaps_hclust_0052 |
|
|
1.4e-22 |
3.3e-19 |
0.0000000000037 |
exponential_vs_stationary_24light | 0.002150 | 0.664 |
| Thaps_hclust_0052 |
|
|
1.4e-22 |
3.3e-19 |
0.0000000000037 |
lowN_TMEVA | 0.037200 | -0.464 |
| Thaps_hclust_0052 |
|
|
1.4e-22 |
3.3e-19 |
0.0000000000037 |
diel_exponential_vs_stationary | 0.001110 | 0.366 |
| Thaps_hclust_0052 |
|
|
1.4e-22 |
3.3e-19 |
0.0000000000037 |
lowSi_TMEVA | 0.091400 | -0.526 |
| Thaps_hclust_0052 |
|
|
1.4e-22 |
3.3e-19 |
0.0000000000037 |
highlight_arrays | 0.002540 | -0.308 |
| Title | Cluster Plot | Dendrogram | e-value | e-value | e-value | Condition | Condition FDR | Condition Difference |
|---|---|---|---|---|---|---|---|---|
| Thaps_hclust_0028 |
 |
|
1.6e-27 |
6.8e-18 |
0.0000000000000078 |
diel_light_vs_dark | 0.000485 | 0.467 |
| Thaps_hclust_0028 |
|
|
1.6e-27 |
6.8e-18 |
0.0000000000000078 |
lowFe_KTKB_Day3 | 0.859000 | -0.0308 |
| Thaps_hclust_0028 |
|
|
1.6e-27 |
6.8e-18 |
0.0000000000000078 |
lowFe_KTKB_Day5 | 0.908000 | 0.0157 |
| Thaps_hclust_0028 |
|
|
1.6e-27 |
6.8e-18 |
0.0000000000000078 |
BaP | 0.080000 | -0.197 |
| Thaps_hclust_0028 |
|
|
1.6e-27 |
6.8e-18 |
0.0000000000000078 |
exponential_vs_stationary_24highlight | 0.000526 | 0.591 |
| Thaps_hclust_0028 |
|
|
1.6e-27 |
6.8e-18 |
0.0000000000000078 |
co2_elevated_stat_arrays | 0.001190 | -0.393 |
| Thaps_hclust_0028 |
|
|
1.6e-27 |
6.8e-18 |
0.0000000000000078 |
lowtemp_TMEVA | 0.061100 | -0.254 |
| Thaps_hclust_0028 |
|
|
1.6e-27 |
6.8e-18 |
0.0000000000000078 |
highpH_TMEVA | 0.112000 | -0.152 |
| Thaps_hclust_0028 |
|
|
1.6e-27 |
6.8e-18 |
0.0000000000000078 |
co2_elevated_expo_arrays | 1.000000 | 0.00454 |
| Thaps_hclust_0028 |
|
|
1.6e-27 |
6.8e-18 |
0.0000000000000078 |
lowFe_TMEVA | 0.001040 | -0.401 |
| Thaps_hclust_0028 |
|
|
1.6e-27 |
6.8e-18 |
0.0000000000000078 |
exponential_vs_stationary_24light | 0.000581 | 1.51 |
| Thaps_hclust_0028 |
|
|
1.6e-27 |
6.8e-18 |
0.0000000000000078 |
lowN_TMEVA | 0.001190 | -0.933 |
| Thaps_hclust_0028 |
|
|
1.6e-27 |
6.8e-18 |
0.0000000000000078 |
diel_exponential_vs_stationary | 0.000602 | 0.543 |
| Thaps_hclust_0028 |
|
|
1.6e-27 |
6.8e-18 |
0.0000000000000078 |
lowSi_TMEVA | 0.001350 | -0.821 |
| Thaps_hclust_0028 |
|
|
1.6e-27 |
6.8e-18 |
0.0000000000000078 |
highlight_arrays | 0.000442 | -0.441 |
| Title | Cluster Plot | Dendrogram | e-value | e-value | e-value | Condition | Condition FDR | Condition Difference |
|---|---|---|---|---|---|---|---|---|
| Thaps_hclust_0047 |
 |
 |
3.4e-21 |
3.4e-17 |
5.5e-19 |
diel_light_vs_dark | 0.027200 | -0.286 |
| Thaps_hclust_0047 |
|
|
3.4e-21 |
3.4e-17 |
5.5e-19 |
lowFe_KTKB_Day3 | 0.000862 | 0.68 |
| Thaps_hclust_0047 |
|
|
3.4e-21 |
3.4e-17 |
5.5e-19 |
lowFe_KTKB_Day5 | 0.028600 | 0.273 |
| Thaps_hclust_0047 |
|
|
3.4e-21 |
3.4e-17 |
5.5e-19 |
BaP | 0.566000 | -0.0908 |
| Thaps_hclust_0047 |
|
|
3.4e-21 |
3.4e-17 |
5.5e-19 |
exponential_vs_stationary_24highlight | 0.008630 | 0.178 |
| Thaps_hclust_0047 |
|
|
3.4e-21 |
3.4e-17 |
5.5e-19 |
co2_elevated_stat_arrays | 0.475000 | 0.154 |
| Thaps_hclust_0047 |
|
|
3.4e-21 |
3.4e-17 |
5.5e-19 |
lowtemp_TMEVA | 0.000735 | 0.819 |
| Thaps_hclust_0047 |
|
|
3.4e-21 |
3.4e-17 |
5.5e-19 |
highpH_TMEVA | 0.167000 | -0.156 |
| Thaps_hclust_0047 |
|
|
3.4e-21 |
3.4e-17 |
5.5e-19 |
co2_elevated_expo_arrays | 0.001390 | -0.332 |
| Thaps_hclust_0047 |
|
|
3.4e-21 |
3.4e-17 |
5.5e-19 |
lowFe_TMEVA | 0.671000 | 0.125 |
| Thaps_hclust_0047 |
|
|
3.4e-21 |
3.4e-17 |
5.5e-19 |
exponential_vs_stationary_24light | 0.419000 | 0.206 |
| Thaps_hclust_0047 |
|
|
3.4e-21 |
3.4e-17 |
5.5e-19 |
lowN_TMEVA | 0.027100 | 0.476 |
| Thaps_hclust_0047 |
|
|
3.4e-21 |
3.4e-17 |
5.5e-19 |
diel_exponential_vs_stationary | 0.000602 | -0.383 |
| Thaps_hclust_0047 |
|
|
3.4e-21 |
3.4e-17 |
5.5e-19 |
lowSi_TMEVA | 0.590000 | -0.307 |
| Thaps_hclust_0047 |
|
|
3.4e-21 |
3.4e-17 |
5.5e-19 |
highlight_arrays | 0.000442 | -0.387 |
| Title | Cluster Plot | Dendrogram | e-value | e-value | e-value | Condition | Condition FDR | Condition Difference |
|---|---|---|---|---|---|---|---|---|
| Thaps_hclust_0063 |
 |
 |
9.8e-19 |
5.7e-17 |
8.2e-17 |
diel_light_vs_dark | 0.000485 | -1.49 |
| Thaps_hclust_0063 |
|
|
9.8e-19 |
5.7e-17 |
8.2e-17 |
lowFe_KTKB_Day3 | 0.000862 | -2.08 |
| Thaps_hclust_0063 |
|
|
9.8e-19 |
5.7e-17 |
8.2e-17 |
lowFe_KTKB_Day5 | 0.652000 | -0.0949 |
| Thaps_hclust_0063 |
|
|
9.8e-19 |
5.7e-17 |
8.2e-17 |
BaP | 0.343000 | 0.202 |
| Thaps_hclust_0063 |
|
|
9.8e-19 |
5.7e-17 |
8.2e-17 |
exponential_vs_stationary_24highlight | 0.000526 | 0.445 |
| Thaps_hclust_0063 |
|
|
9.8e-19 |
5.7e-17 |
8.2e-17 |
co2_elevated_stat_arrays | 0.000658 | 0.831 |
| Thaps_hclust_0063 |
|
|
9.8e-19 |
5.7e-17 |
8.2e-17 |
lowtemp_TMEVA | 0.001430 | 0.847 |
| Thaps_hclust_0063 |
|
|
9.8e-19 |
5.7e-17 |
8.2e-17 |
highpH_TMEVA | 0.000725 | -0.651 |
| Thaps_hclust_0063 |
|
|
9.8e-19 |
5.7e-17 |
8.2e-17 |
co2_elevated_expo_arrays | 0.001390 | 0.552 |
| Thaps_hclust_0063 |
|
|
9.8e-19 |
5.7e-17 |
8.2e-17 |
lowFe_TMEVA | 0.300000 | -0.284 |
| Thaps_hclust_0063 |
|
|
9.8e-19 |
5.7e-17 |
8.2e-17 |
exponential_vs_stationary_24light | 0.006670 | 0.772 |
| Thaps_hclust_0063 |
|
|
9.8e-19 |
5.7e-17 |
8.2e-17 |
lowN_TMEVA | 0.730000 | -0.133 |
| Thaps_hclust_0063 |
|
|
9.8e-19 |
5.7e-17 |
8.2e-17 |
diel_exponential_vs_stationary | 0.002530 | 0.529 |
| Thaps_hclust_0063 |
|
|
9.8e-19 |
5.7e-17 |
8.2e-17 |
lowSi_TMEVA | 0.997000 | -0.0904 |
| Thaps_hclust_0063 |
|
|
9.8e-19 |
5.7e-17 |
8.2e-17 |
highlight_arrays | 0.000442 | -0.919 |
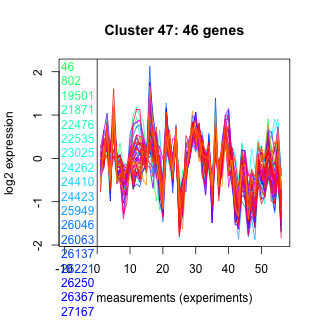
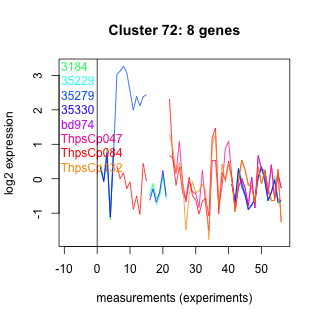
| Title | Cluster Plot | Dendrogram | e-value | e-value | e-value | Condition | Condition FDR | Condition Difference |
|---|---|---|---|---|---|---|---|---|
| Thaps_hclust_0072 |
 |
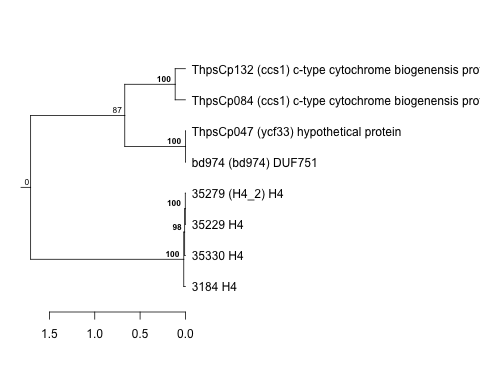 |
1.2e-22 |
1.1e-16 |
0.000000000000011 |
diel_light_vs_dark | 0.629000 | -0.188 |
| Thaps_hclust_0072 |
|
|
1.2e-22 |
1.1e-16 |
0.000000000000011 |
lowFe_KTKB_Day3 | 0.157000 | -0.534 |
| Thaps_hclust_0072 |
|
|
1.2e-22 |
1.1e-16 |
0.000000000000011 |
lowFe_KTKB_Day5 | 0.501000 | -0.218 |
| Thaps_hclust_0072 |
|
|
1.2e-22 |
1.1e-16 |
0.000000000000011 |
BaP | 0.284000 | -0.374 |
| Thaps_hclust_0072 |
|
|
1.2e-22 |
1.1e-16 |
0.000000000000011 |
exponential_vs_stationary_24highlight | 0.035600 | 0.354 |
| Thaps_hclust_0072 |
|
|
1.2e-22 |
1.1e-16 |
0.000000000000011 |
co2_elevated_stat_arrays | 0.848000 | -0.0679 |
| Thaps_hclust_0072 |
|
|
1.2e-22 |
1.1e-16 |
0.000000000000011 |
lowtemp_TMEVA | 0.044600 | 0.856 |
| Thaps_hclust_0072 |
|
|
1.2e-22 |
1.1e-16 |
0.000000000000011 |
highpH_TMEVA | 0.131000 | 0.364 |