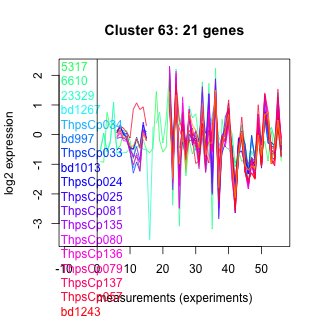
Thaps_hclust_0063 Hierarchical Clustering
Thalassiosira pseudonana
| Cluster Plot | Conditions Plot | Dendrogram |
|---|---|---|
 |
 |
 |
| GO ID | Go Term | p-value | q-value | Cluster |
|---|---|---|---|---|
| GO:0044267 | cellular protein metabolism | 0.00289436 | 1 | Thaps_hclust_0063 |
|
5317 : hypothetical protein |
ThpsCp033 : (rpoC1) RNA polymerase beta' subunit |
ThpsCp135 : (secA) preprotein translocase subunit SecA |
ThpsCp057 : (secG) preprotein translocase SecG subunit |
|
6610 : hypothetical protein |
bd1013 : (bd1013) PRX_Typ2cys |
ThpsCp080 : (rpl27) ribosomal protein L27 |
bd1243 : (bd1243) rpl33 |
|
23329 : groEL |
ThpsCp024 : (rpl35) ribosomal protein L35 |
ThpsCp136 : (rpl27) ribosomal protein L27 |
ThpsCp036 : (rpl33) ribosomal protein L33 |
|
bd1267 : (bd1267) rpoB |
ThpsCp025 : (rpl20) ribosomal protein L20 |
ThpsCp079 : (rpl21) ribosomal protein L21 |
bd1435 : (bd1435) ycf3 |
|
ThpsCp034 : (rpoB) RNA polymerase beta subunit |
ThpsCp081 : (secA) preprotein translocase subunit SecA |
ThpsCp137 : (rpl21) ribosomal protein L21 |
ThpsCp038 : (ycf3) photosystem I assembly protein Ycf3 |
|
bd997 : (bd997) rpoC1 |
| Condition | Condition | Difference | FDR |
|---|---|---|---|
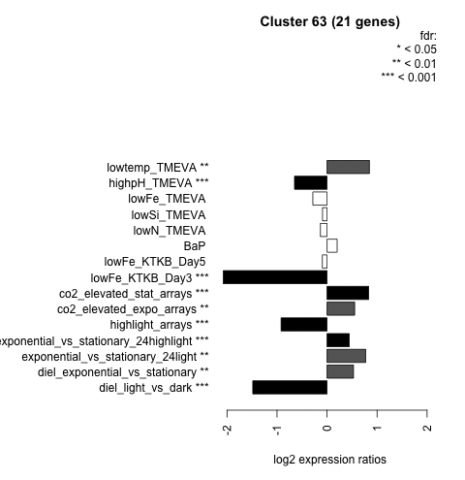
| diel_light_vs_dark | diel_light_vs_dark | -1.490 | 0.000485 |
| lowFe_KTKB_Day3 | lowFe_KTKB_Day3 | -2.080 | 0.000862 |
| lowFe_KTKB_Day5 | lowFe_KTKB_Day5 | -0.095 | 0.652 |
| BaP | BaP | 0.202 | 0.343 |
| exponential_vs_stationary_24highlight | exponential_vs_stationary_24highlight | 0.445 | 0.000526 |
| co2_elevated_stat_arrays | co2_elevated_stat_arrays | 0.831 | 0.000658 |
| lowtemp_TMEVA | lowtemp_TMEVA | 0.847 | 0.00143 |
| highpH_TMEVA | highpH_TMEVA | -0.651 | 0.000725 |
| co2_elevated_expo_arrays | co2_elevated_expo_arrays | 0.552 | 0.00139 |
| lowFe_TMEVA | lowFe_TMEVA | -0.284 | 0.3 |
| exponential_vs_stationary_24light | exponential_vs_stationary_24light | 0.772 | 0.00667 |
| lowN_TMEVA | lowN_TMEVA | -0.133 | 0.73 |
| diel_exponential_vs_stationary | diel_exponential_vs_stationary | 0.529 | 0.00253 |
| lowSi_TMEVA | lowSi_TMEVA | -0.090 | 0.997 |
| highlight_arrays | highlight_arrays | -0.919 | 0.000442 |