Hierarchical Clusters
Displaying 7201 - 7300 of 7500
| Title | Cluster Plot | Dendrogram | e-value | e-value | e-value | Condition | Condition FDR | Condition Difference |
|---|---|---|---|---|---|---|---|---|
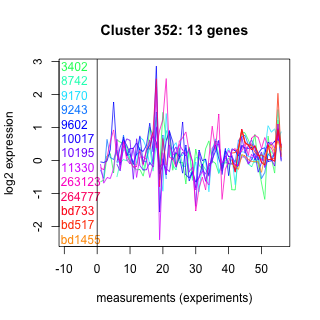
| Thaps_hclust_0352 |
 |
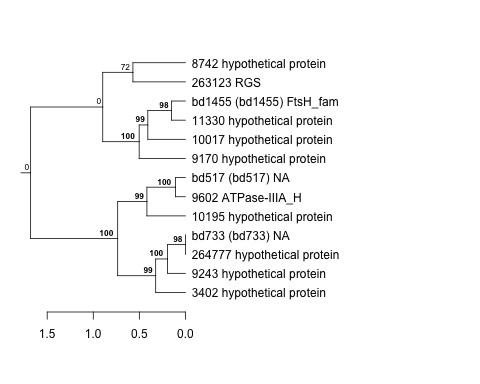 |
8.7 |
78 |
79 |
exponential_vs_stationary_24highlight | 0.920000 | -0.0177 |
| Thaps_hclust_0352 |
|
|
8.7 |
78 |
79 |
co2_elevated_stat_arrays | 0.213000 | 0.323 |
| Thaps_hclust_0352 |
|
|
8.7 |
78 |
79 |
lowtemp_TMEVA | 0.177000 | 0.423 |
| Thaps_hclust_0352 |
|
|
8.7 |
78 |
79 |
highpH_TMEVA | 0.182000 | -0.257 |
| Thaps_hclust_0352 |
|
|
8.7 |
78 |
79 |
co2_elevated_expo_arrays | 0.464000 | 0.163 |
| Thaps_hclust_0352 |
|
|
8.7 |
78 |
79 |
lowFe_TMEVA | 0.181000 | -0.43 |
| Thaps_hclust_0352 |
|
|
8.7 |
78 |
79 |
exponential_vs_stationary_24light | 0.800000 | 0.125 |
| Thaps_hclust_0352 |
|
|
8.7 |
78 |
79 |
lowN_TMEVA | 0.861000 | 0.0675 |
| Thaps_hclust_0352 |
|
|
8.7 |
78 |
79 |
diel_exponential_vs_stationary | 0.349000 | 0.225 |
| Thaps_hclust_0352 |
|
|
8.7 |
78 |
79 |
lowSi_TMEVA | 0.976000 | 0.132 |
| Thaps_hclust_0352 |
|
|
8.7 |
78 |
79 |
highlight_arrays | 0.799000 | -0.0585 |
| Thaps_hclust_0352 |
|
|
8.7 |
78 |
79 |
diel_light_vs_dark | 0.902000 | 0.049 |
| Thaps_hclust_0352 |
|
|
8.7 |
78 |
79 |
lowFe_KTKB_Day3 | 0.186000 | 0.386 |
| Thaps_hclust_0352 |
|
|
8.7 |
78 |
79 |
lowFe_KTKB_Day5 | 0.260000 | 0.286 |
| Thaps_hclust_0352 |
|
|
8.7 |
78 |
79 |
BaP | 0.119000 | 0.406 |
| Title | Cluster Plot | Dendrogram | e-value | e-value | e-value | Condition | Condition FDR | Condition Difference |
|---|---|---|---|---|---|---|---|---|
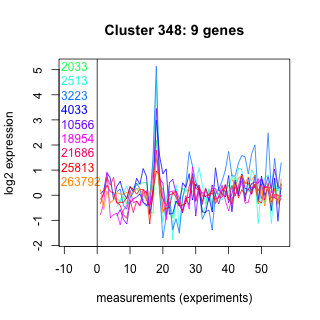
| Thaps_hclust_0348 |
 |
 |
8.7 |
34 |
60 |
diel_light_vs_dark | 0.952000 | -0.0376 |
| Thaps_hclust_0348 |
|
|
8.7 |
34 |
60 |
lowFe_KTKB_Day3 | 0.200000 | -0.447 |
| Thaps_hclust_0348 |
|
|
8.7 |
34 |
60 |
lowFe_KTKB_Day5 | 0.146000 | 0.437 |
| Thaps_hclust_0348 |
|
|
8.7 |
34 |
60 |
BaP | 0.042300 | 0.635 |
| Thaps_hclust_0348 |
|
|
8.7 |
34 |
60 |
exponential_vs_stationary_24highlight | 0.166000 | -0.219 |
| Thaps_hclust_0348 |
|
|
8.7 |
34 |
60 |
co2_elevated_stat_arrays | 0.468000 | 0.225 |
| Thaps_hclust_0348 |
|
|
8.7 |
34 |
60 |
lowtemp_TMEVA | 0.884000 | -0.0656 |
| Thaps_hclust_0348 |
|
|
8.7 |
34 |
60 |
highpH_TMEVA | 0.376000 | -0.201 |
| Thaps_hclust_0348 |
|
|
8.7 |
34 |
60 |
co2_elevated_expo_arrays | 0.443000 | 0.197 |
| Thaps_hclust_0348 |
|
|
8.7 |
34 |
60 |
lowFe_TMEVA | 0.836000 | -0.0996 |
| Thaps_hclust_0348 |
|
|
8.7 |
34 |
60 |
exponential_vs_stationary_24light | 0.180000 | -0.584 |
| Thaps_hclust_0348 |
|
|
8.7 |
34 |
60 |
lowN_TMEVA | 0.179000 | 0.618 |
| Thaps_hclust_0348 |
|
|
8.7 |
34 |
60 |
diel_exponential_vs_stationary | 0.094900 | -0.448 |
| Thaps_hclust_0348 |
|
|
8.7 |
34 |
60 |
lowSi_TMEVA | 1.000000 | 0.00471 |
| Thaps_hclust_0348 |
|
|
8.7 |
34 |
60 |
highlight_arrays | 0.239000 | 0.278 |
| Title | Cluster Plot | Dendrogram | e-value | e-value | e-value | Condition | Condition FDR | Condition Difference |
|---|---|---|---|---|---|---|---|---|
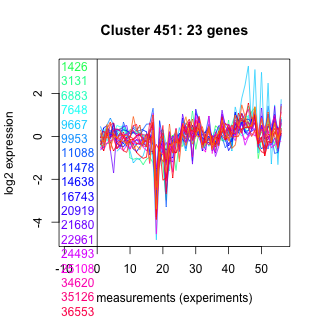
| Thaps_hclust_0451 |
 |
 |
10 |
0.0026 |
160 |
highlight_arrays | 0.001940 | 0.427 |
| Thaps_hclust_0451 |
|
|
10 |
0.0026 |
160 |
diel_light_vs_dark | 0.446000 | -0.167 |
| Thaps_hclust_0451 |
|
|
10 |
0.0026 |
160 |
lowFe_KTKB_Day3 | 0.406000 | -0.199 |
| Thaps_hclust_0451 |
|
|
10 |
0.0026 |
160 |
lowFe_KTKB_Day5 | 0.660000 | 0.0903 |
| Thaps_hclust_0451 |
|
|
10 |
0.0026 |
160 |
BaP | 0.000370 | -1.3 |
| Thaps_hclust_0451 |
|
|
10 |
0.0026 |
160 |
exponential_vs_stationary_24highlight | 0.000926 | -0.32 |
| Thaps_hclust_0451 |
|
|
10 |
0.0026 |
160 |
co2_elevated_stat_arrays | 0.626000 | 0.126 |
| Thaps_hclust_0451 |
|
|
10 |
0.0026 |
160 |
lowtemp_TMEVA | 0.818000 | 0.0659 |
| Thaps_hclust_0451 |
|
|
10 |
0.0026 |
160 |
highpH_TMEVA | 0.254000 | -0.173 |
| Thaps_hclust_0451 |
|
|
10 |
0.0026 |
160 |
co2_elevated_expo_arrays | 0.740000 | 0.0922 |
| Thaps_hclust_0451 |
|
|
10 |
0.0026 |
160 |
lowFe_TMEVA | 0.553000 | -0.172 |
| Thaps_hclust_0451 |
|
|
10 |
0.0026 |
160 |
exponential_vs_stationary_24light | 0.022100 | -0.649 |
| Thaps_hclust_0451 |
|
|
10 |
0.0026 |
160 |
lowN_TMEVA | 0.633000 | 0.175 |
| Thaps_hclust_0451 |
|
|
10 |
0.0026 |
160 |
diel_exponential_vs_stationary | 0.014600 | -0.386 |
| Thaps_hclust_0451 |
|
|
10 |
0.0026 |
160 |
lowSi_TMEVA | 1.000000 | 0.00553 |
| Title | Cluster Plot | Dendrogram | e-value | e-value | e-value | Condition | Condition FDR | Condition Difference |
|---|---|---|---|---|---|---|---|---|
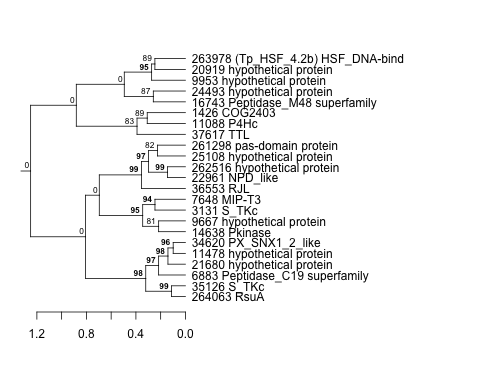
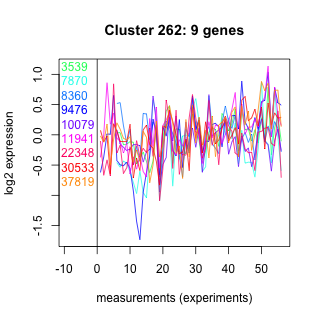
| Thaps_hclust_0262 |
 |
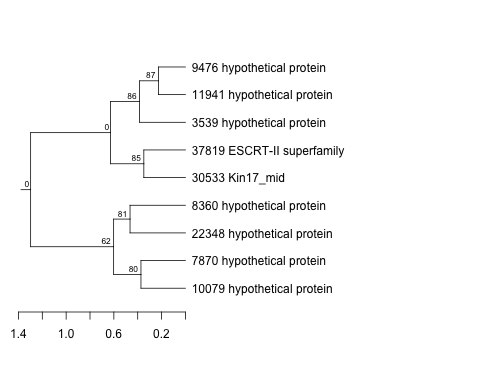 |
12 |
130 |
130 |
lowFe_KTKB_Day5 | 1.000000 | -0.00176 |
| Thaps_hclust_0262 |
|
|
12 |
130 |
130 |
BaP | 0.656000 | -0.158 |
| Thaps_hclust_0262 |
|
|
12 |
130 |
130 |
exponential_vs_stationary_24highlight | 0.274000 | -0.173 |
| Thaps_hclust_0262 |
|
|
12 |
130 |
130 |
co2_elevated_stat_arrays | 0.697000 | -0.127 |
| Thaps_hclust_0262 |
|
|
12 |
130 |
130 |
lowtemp_TMEVA | 0.294000 | 0.39 |
| Thaps_hclust_0262 |
|
|
12 |
130 |
130 |
highpH_TMEVA | 0.358000 | -0.208 |
| Thaps_hclust_0262 |
|
|
12 |
130 |
130 |
co2_elevated_expo_arrays | 0.985000 | -0.0121 |
| Thaps_hclust_0262 |
|
|
12 |
130 |
130 |
lowFe_TMEVA | 0.482000 | -0.254 |
| Thaps_hclust_0262 |
|
|
12 |
130 |
130 |
exponential_vs_stationary_24light | 0.682000 | -0.213 |
| Thaps_hclust_0262 |
|
|
12 |
130 |
130 |
lowN_TMEVA | 0.789000 | 0.123 |
| Thaps_hclust_0262 |
|
|
12 |
130 |
130 |
diel_exponential_vs_stationary | 0.533000 | -0.179 |
| Thaps_hclust_0262 |
|
|
12 |
130 |
130 |
lowSi_TMEVA | 0.707000 | -0.328 |
| Thaps_hclust_0262 |
|
|
12 |
130 |
130 |
highlight_arrays | 0.462000 | -0.18 |
| Thaps_hclust_0262 |
|
|
12 |
130 |
130 |
diel_light_vs_dark | 0.919000 | 0.0497 |
| Thaps_hclust_0262 |
|
|
12 |
130 |
130 |
lowFe_KTKB_Day3 | 0.527000 | -0.24 |
| Title | Cluster Plot | Dendrogram | e-value | e-value | e-value | Condition | Condition FDR | Condition Difference |
|---|---|---|---|---|---|---|---|---|
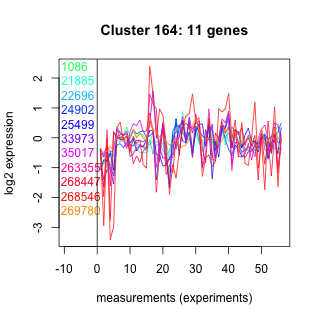
| Thaps_hclust_0164 |
 |
 |
13 |
58 |
65 |
co2_elevated_stat_arrays | 0.483000 | -0.201 |
| Thaps_hclust_0164 |
|
|
13 |
58 |
65 |
lowtemp_TMEVA | 0.019900 | -0.833 |
| Thaps_hclust_0164 |
|
|
13 |
58 |
65 |
highpH_TMEVA | 0.006930 | -0.643 |
| Thaps_hclust_0164 |
|
|
13 |
58 |
65 |
co2_elevated_expo_arrays | 0.873000 | 0.0706 |
| Thaps_hclust_0164 |
|
|
13 |
58 |
65 |
lowFe_TMEVA | 0.001040 | -1.14 |
| Thaps_hclust_0164 |
|
|
13 |
58 |
65 |
exponential_vs_stationary_24light | 0.399000 | -0.355 |
| Thaps_hclust_0164 |
|
|
13 |
58 |
65 |
lowN_TMEVA | 0.219000 | -0.509 |
| Thaps_hclust_0164 |
|
|
13 |
58 |
65 |
diel_exponential_vs_stationary | 0.073600 | -0.425 |
| Thaps_hclust_0164 |
|
|
13 |
58 |
65 |
lowSi_TMEVA | 0.014800 | -1.18 |
| Thaps_hclust_0164 |
|
|
13 |
58 |
65 |
highlight_arrays | 0.822000 | -0.0527 |
| Thaps_hclust_0164 |
|
|
13 |
58 |
65 |
diel_light_vs_dark | 0.731000 | -0.116 |
| Thaps_hclust_0164 |
|
|
13 |
58 |
65 |
lowFe_KTKB_Day3 | 0.070400 | 0.566 |
| Thaps_hclust_0164 |
|
|
13 |
58 |
65 |
lowFe_KTKB_Day5 | 0.096600 | 0.448 |
| Thaps_hclust_0164 |
|
|
13 |
58 |
65 |
BaP | 0.339000 | -0.288 |
| Thaps_hclust_0164 |
|
|
13 |
58 |
65 |
exponential_vs_stationary_24highlight | 0.258000 | -0.166 |
| Title | Cluster Plot | Dendrogram | e-value | e-value | e-value | Condition | Condition FDR | Condition Difference |
|---|---|---|---|---|---|---|---|---|
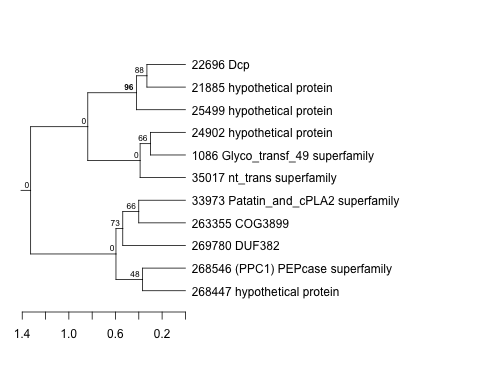
| Thaps_hclust_0249 |
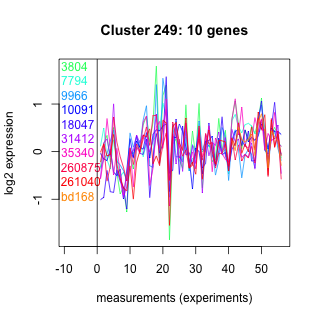 |
 |
14 |
39 |
180 |
lowtemp_TMEVA | 0.646000 | 0.169 |
| Thaps_hclust_0249 |
|
|
14 |
39 |
180 |
highpH_TMEVA | 0.126000 | -0.332 |
| Thaps_hclust_0249 |
|
|
14 |
39 |
180 |
co2_elevated_expo_arrays | 0.873000 | -0.0718 |
| Thaps_hclust_0249 |
|
|
14 |
39 |
180 |
lowFe_TMEVA | 0.960000 | -0.0288 |
| Thaps_hclust_0249 |
|
|
14 |
39 |
180 |
exponential_vs_stationary_24light | 0.704000 | 0.186 |
| Thaps_hclust_0249 |
|
|
14 |
39 |
180 |
lowN_TMEVA | 0.963000 | -0.0225 |
| Thaps_hclust_0249 |
|
|
14 |
39 |
180 |
diel_exponential_vs_stationary | 0.752000 | -0.0932 |
| Thaps_hclust_0249 |
|
|
14 |
39 |
180 |
lowSi_TMEVA | 0.929000 | -0.171 |
| Thaps_hclust_0249 |
|
|
14 |
39 |
180 |
highlight_arrays | 0.780000 | -0.0721 |
| Title | Cluster Plot | Dendrogram | e-value | e-value | e-value | Condition | Condition FDR | Condition Difference |
|---|---|---|---|---|---|---|---|---|
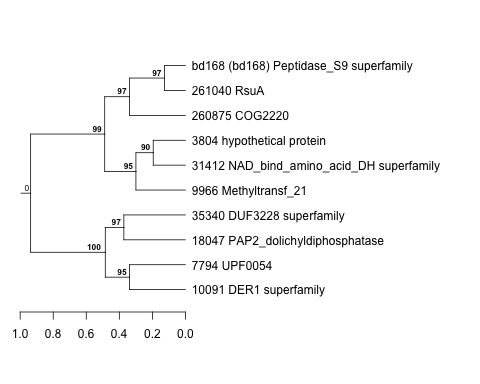
| Thaps_hclust_0444 |
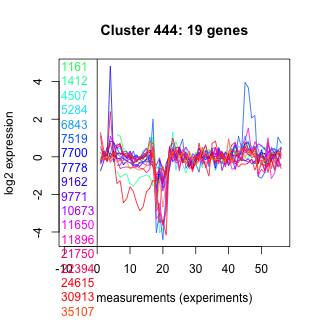 |
 |
14 |
140 |
1.6 |
highpH_TMEVA | 0.607000 | 0.0951 |
| Thaps_hclust_0444 |
|
|
14 |
140 |
1.6 |
co2_elevated_expo_arrays | 0.944000 | -0.0348 |
| Thaps_hclust_0444 |
|
|
14 |
140 |
1.6 |
lowFe_TMEVA | 0.904000 | 0.0495 |
| Thaps_hclust_0444 |
|
|
14 |
140 |
1.6 |
exponential_vs_stationary_24light | 0.813000 | -0.101 |
| Thaps_hclust_0444 |
|
|
14 |
140 |
1.6 |
lowN_TMEVA | 0.967000 | 0.0165 |
| Thaps_hclust_0444 |
|
|
14 |
140 |
1.6 |
diel_exponential_vs_stationary | 0.487000 | 0.141 |
| Thaps_hclust_0444 |
|
|
14 |
140 |
1.6 |
lowSi_TMEVA | 0.071500 | 0.728 |
| Thaps_hclust_0444 |
|
|
14 |
140 |
1.6 |
highlight_arrays | 0.060700 | 0.294 |
| Title | Cluster Plot | Dendrogram | e-value | e-value | e-value | Condition | Condition FDR | Condition Difference |
|---|---|---|---|---|---|---|---|---|
| Thaps_hclust_0433 |
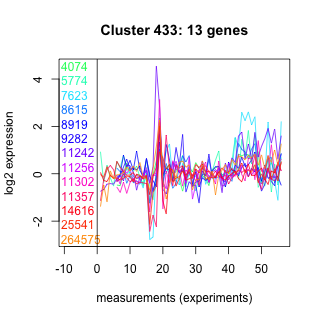 |
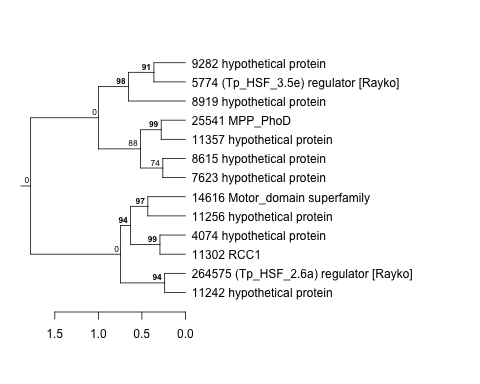 |
14 |
54 |
440 |
lowSi_TMEVA | 1.000000 | -0.0409 |
| Thaps_hclust_0433 |
|
|
14 |
54 |
440 |
highlight_arrays | 0.108000 | 0.312 |
| Thaps_hclust_0433 |
|
|
14 |
54 |
440 |
diel_light_vs_dark | 0.686000 | -0.13 |
| Thaps_hclust_0433 |
|
|
14 |
54 |
440 |
lowFe_KTKB_Day3 | 0.000862 | -1.11 |
| Thaps_hclust_0433 |
|
|
14 |
54 |
440 |
lowFe_KTKB_Day5 | 0.017400 | -0.591 |
| Thaps_hclust_0433 |
|
|
14 |
54 |
440 |
BaP | 0.051800 | 0.495 |
| Thaps_hclust_0433 |
|
|
14 |
54 |
440 |
exponential_vs_stationary_24highlight | 0.061500 | -0.244 |
| Thaps_hclust_0433 |
|
|
14 |
54 |
440 |
co2_elevated_stat_arrays | 0.111000 | 0.408 |