Hierarchical Clusters
Displaying 1801 - 1900 of 7500
| Title | Cluster Plot | Dendrogram | e-value | e-value | e-value | Condition | Condition FDR | Condition Difference |
|---|---|---|---|---|---|---|---|---|
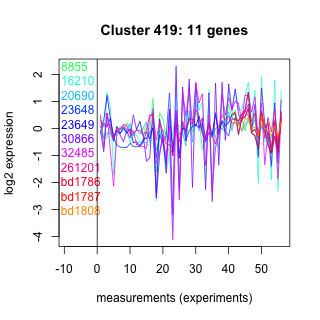
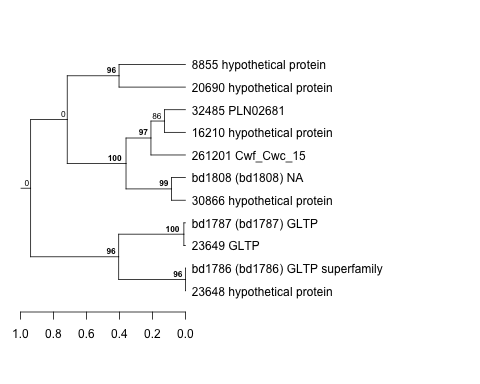
| Thaps_hclust_0419 |
 |
 |
0.0014 |
0.00031 |
0.0014 |
diel_light_vs_dark | 0.000485 | -1.13 |
| Thaps_hclust_0419 |
|
|
0.0014 |
0.00031 |
0.0014 |
lowFe_KTKB_Day3 | 0.447000 | -0.254 |
| Thaps_hclust_0419 |
|
|
0.0014 |
0.00031 |
0.0014 |
lowFe_KTKB_Day5 | 0.090100 | 0.459 |
| Thaps_hclust_0419 |
|
|
0.0014 |
0.00031 |
0.0014 |
BaP | 0.013200 | -0.723 |
| Thaps_hclust_0419 |
|
|
0.0014 |
0.00031 |
0.0014 |
exponential_vs_stationary_24highlight | 0.081700 | -0.245 |
| Thaps_hclust_0419 |
|
|
0.0014 |
0.00031 |
0.0014 |
co2_elevated_stat_arrays | 0.189000 | -0.364 |
| Thaps_hclust_0419 |
|
|
0.0014 |
0.00031 |
0.0014 |
lowtemp_TMEVA | 0.035900 | -0.75 |
| Thaps_hclust_0419 |
|
|
0.0014 |
0.00031 |
0.0014 |
highpH_TMEVA | 0.585000 | 0.125 |
| Thaps_hclust_0419 |
|
|
0.0014 |
0.00031 |
0.0014 |
co2_elevated_expo_arrays | 0.888000 | -0.0645 |
| Thaps_hclust_0419 |
|
|
0.0014 |
0.00031 |
0.0014 |
lowFe_TMEVA | 0.399000 | -0.289 |
| Thaps_hclust_0419 |
|
|
0.0014 |
0.00031 |
0.0014 |
exponential_vs_stationary_24light | 0.008020 | -1.05 |
| Thaps_hclust_0419 |
|
|
0.0014 |
0.00031 |
0.0014 |
lowN_TMEVA | 0.310000 | 0.427 |
| Thaps_hclust_0419 |
|
|
0.0014 |
0.00031 |
0.0014 |
diel_exponential_vs_stationary | 0.013500 | -0.613 |
| Thaps_hclust_0419 |
|
|
0.0014 |
0.00031 |
0.0014 |
lowSi_TMEVA | 0.983000 | 0.106 |
| Thaps_hclust_0419 |
|
|
0.0014 |
0.00031 |
0.0014 |
highlight_arrays | 0.005170 | 0.595 |
| Title | Cluster Plot | Dendrogram | e-value | e-value | e-value | Condition | Condition FDR | Condition Difference |
|---|---|---|---|---|---|---|---|---|
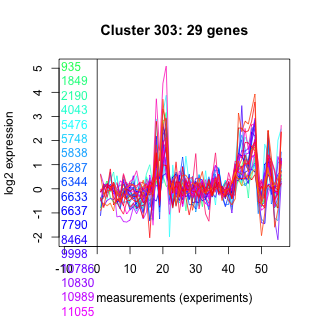
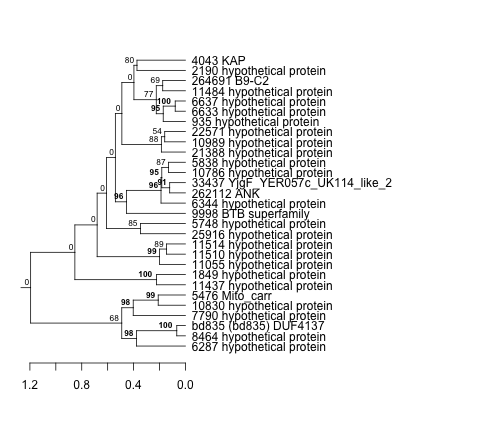
| Thaps_hclust_0303 |
 |
 |
0.00096 |
0.0021 |
0.0014 |
lowtemp_TMEVA | 0.740000 | -0.0793 |
| Thaps_hclust_0303 |
|
|
0.00096 |
0.0021 |
0.0014 |
highpH_TMEVA | 0.019600 | -0.306 |
| Thaps_hclust_0303 |
|
|
0.00096 |
0.0021 |
0.0014 |
co2_elevated_expo_arrays | 0.009180 | 0.288 |
| Thaps_hclust_0303 |
|
|
0.00096 |
0.0021 |
0.0014 |
lowFe_TMEVA | 0.549000 | -0.167 |
| Thaps_hclust_0303 |
|
|
0.00096 |
0.0021 |
0.0014 |
exponential_vs_stationary_24light | 0.296000 | -0.295 |
| Thaps_hclust_0303 |
|
|
0.00096 |
0.0021 |
0.0014 |
lowN_TMEVA | 0.861000 | -0.0653 |
| Thaps_hclust_0303 |
|
|
0.00096 |
0.0021 |
0.0014 |
diel_exponential_vs_stationary | 0.883000 | 0.0308 |
| Thaps_hclust_0303 |
|
|
0.00096 |
0.0021 |
0.0014 |
lowSi_TMEVA | 1.000000 | 0.0744 |
| Thaps_hclust_0303 |
|
|
0.00096 |
0.0021 |
0.0014 |
highlight_arrays | 0.000442 | 0.842 |
| Thaps_hclust_0303 |
|
|
0.00096 |
0.0021 |
0.0014 |
diel_light_vs_dark | 0.993000 | 0.00145 |
| Thaps_hclust_0303 |
|
|
0.00096 |
0.0021 |
0.0014 |
lowFe_KTKB_Day3 | 0.604000 | -0.117 |
| Thaps_hclust_0303 |
|
|
0.00096 |
0.0021 |
0.0014 |
lowFe_KTKB_Day5 | 0.152000 | -0.238 |
| Thaps_hclust_0303 |
|
|
0.00096 |
0.0021 |
0.0014 |
BaP | 0.000370 | 1.26 |
| Thaps_hclust_0303 |
|
|
0.00096 |
0.0021 |
0.0014 |
exponential_vs_stationary_24highlight | 0.009290 | -0.218 |
| Thaps_hclust_0303 |
|
|
0.00096 |
0.0021 |
0.0014 |
co2_elevated_stat_arrays | 0.000658 | 1.12 |
| Title | Cluster Plot | Dendrogram | e-value | e-value | e-value | Condition | Condition FDR | Condition Difference |
|---|---|---|---|---|---|---|---|---|
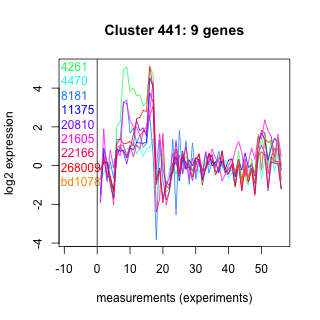
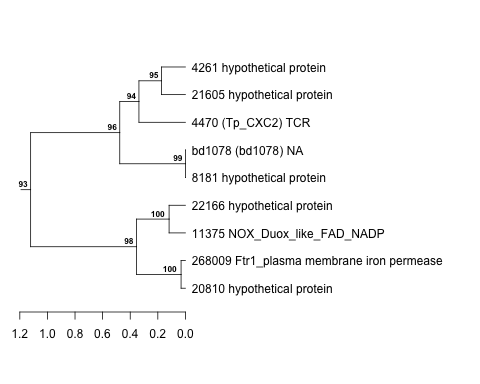
| Thaps_hclust_0441 |
 |
 |
0.00081 |
0.001 |
0.0015 |
BaP | 0.029900 | -0.695 |
| Thaps_hclust_0441 |
|
|
0.00081 |
0.001 |
0.0015 |
exponential_vs_stationary_24highlight | 0.000526 | 0.741 |
| Thaps_hclust_0441 |
|
|
0.00081 |
0.001 |
0.0015 |
co2_elevated_stat_arrays | 0.141000 | -0.435 |
| Thaps_hclust_0441 |
|
|
0.00081 |
0.001 |
0.0015 |
lowtemp_TMEVA | 0.010800 | -1.07 |
| Thaps_hclust_0441 |
|
|
0.00081 |
0.001 |
0.0015 |
highpH_TMEVA | 0.000725 | -1.07 |
| Thaps_hclust_0441 |
|
|
0.00081 |
0.001 |
0.0015 |
co2_elevated_expo_arrays | 0.464000 | 0.189 |
| Thaps_hclust_0441 |
|
|
0.00081 |
0.001 |
0.0015 |
lowFe_TMEVA | 0.138000 | 0.562 |
| Thaps_hclust_0441 |
|
|
0.00081 |
0.001 |
0.0015 |
exponential_vs_stationary_24light | 0.053300 | 0.861 |
| Thaps_hclust_0441 |
|
|
0.00081 |
0.001 |
0.0015 |
lowN_TMEVA | 0.572000 | -0.258 |
| Thaps_hclust_0441 |
|
|
0.00081 |
0.001 |
0.0015 |
diel_exponential_vs_stationary | 0.889000 | -0.0488 |
| Thaps_hclust_0441 |
|
|
0.00081 |
0.001 |
0.0015 |
lowSi_TMEVA | 0.711000 | -0.325 |
| Thaps_hclust_0441 |
|
|
0.00081 |
0.001 |
0.0015 |
highlight_arrays | 0.000442 | -0.88 |
| Thaps_hclust_0441 |
|
|
0.00081 |
0.001 |
0.0015 |
diel_light_vs_dark | 0.446000 | 0.258 |
| Thaps_hclust_0441 |
|
|
0.00081 |
0.001 |
0.0015 |
lowFe_KTKB_Day3 | 0.000862 | 3.43 |
| Thaps_hclust_0441 |
|
|
0.00081 |
0.001 |
0.0015 |
lowFe_KTKB_Day5 | 0.001320 | 3.17 |
| Title | Cluster Plot | Dendrogram | e-value | e-value | e-value | Condition | Condition FDR | Condition Difference |
|---|---|---|---|---|---|---|---|---|
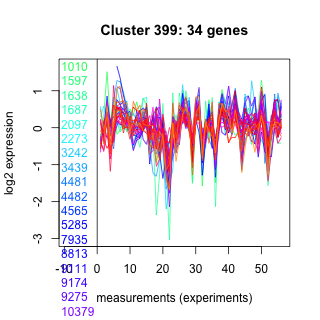
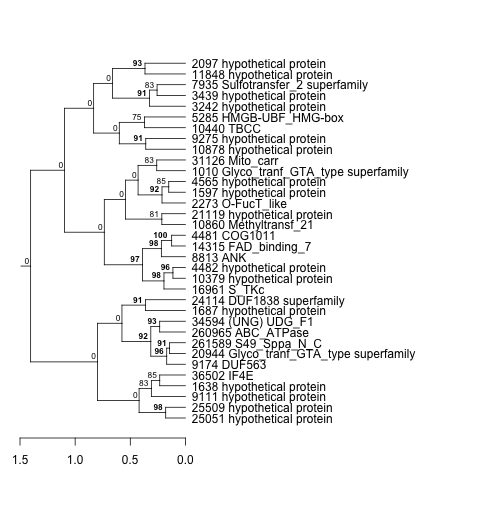
| Thaps_hclust_0399 |
 |
 |
0.0039 |
0.16 |
0.0016 |
lowSi_TMEVA | 0.824000 | -0.234 |
| Thaps_hclust_0399 |
|
|
0.0039 |
0.16 |
0.0016 |
highlight_arrays | 0.697000 | 0.0573 |
| Thaps_hclust_0399 |
|
|
0.0039 |
0.16 |
0.0016 |
diel_light_vs_dark | 0.415000 | 0.145 |
| Thaps_hclust_0399 |
|
|
0.0039 |
0.16 |
0.0016 |
lowFe_KTKB_Day3 | 0.116000 | -0.277 |
| Thaps_hclust_0399 |
|
|
0.0039 |
0.16 |
0.0016 |
lowFe_KTKB_Day5 | 0.354000 | -0.148 |
| Thaps_hclust_0399 |
|
|
0.0039 |
0.16 |
0.0016 |
BaP | 0.010900 | -0.404 |
| Thaps_hclust_0399 |
|
|
0.0039 |
0.16 |
0.0016 |
exponential_vs_stationary_24highlight | 0.864000 | -0.0166 |
| Thaps_hclust_0399 |
|
|
0.0039 |
0.16 |
0.0016 |
co2_elevated_stat_arrays | 0.001190 | -0.523 |
| Thaps_hclust_0399 |
|
|
0.0039 |
0.16 |
0.0016 |
lowtemp_TMEVA | 0.698000 | 0.0878 |
| Thaps_hclust_0399 |
|
|
0.0039 |
0.16 |
0.0016 |
highpH_TMEVA | 0.264000 | -0.147 |
| Thaps_hclust_0399 |
|
|
0.0039 |
0.16 |
0.0016 |
co2_elevated_expo_arrays | 0.985000 | 0.0119 |
| Thaps_hclust_0399 |
|
|
0.0039 |
0.16 |
0.0016 |
lowFe_TMEVA | 0.622000 | -0.144 |
| Thaps_hclust_0399 |
|
|
0.0039 |
0.16 |
0.0016 |
exponential_vs_stationary_24light | 0.679000 | -0.136 |
| Thaps_hclust_0399 |
|
|
0.0039 |
0.16 |
0.0016 |
lowN_TMEVA | 0.255000 | 0.321 |
| Thaps_hclust_0399 |
|
|
0.0039 |
0.16 |
0.0016 |
diel_exponential_vs_stationary | 0.001110 | -0.447 |
| Title | Cluster Plot | Dendrogram | e-value | e-value | e-value | Condition | Condition FDR | Condition Difference |
|---|---|---|---|---|---|---|---|---|
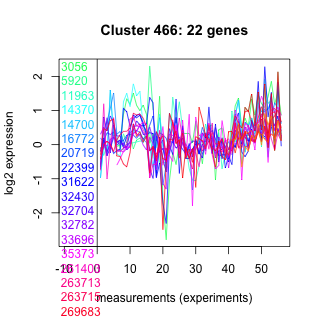
| Thaps_hclust_0466 |
 |
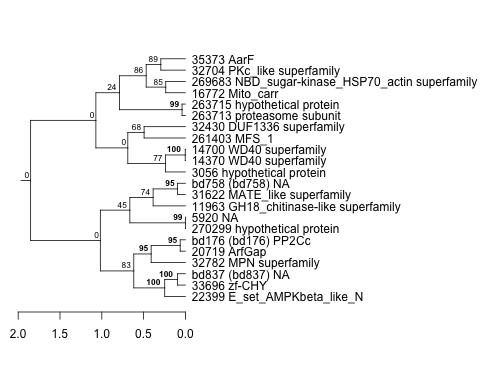 |
0.0000055 |
0.000014 |
0.0017 |
lowFe_TMEVA | 0.416000 | 0.227 |
| Thaps_hclust_0466 |
|
|
0.0000055 |
0.000014 |
0.0017 |
exponential_vs_stationary_24light | 0.116000 | 0.471 |
| Thaps_hclust_0466 |
|
|
0.0000055 |
0.000014 |
0.0017 |
lowN_TMEVA | 0.959000 | 0.0213 |
| Thaps_hclust_0466 |
|
|
0.0000055 |
0.000014 |
0.0017 |
diel_exponential_vs_stationary | 0.071100 | 0.292 |
| Thaps_hclust_0466 |
|
|
0.0000055 |
0.000014 |
0.0017 |
lowSi_TMEVA | 0.500000 | 0.39 |
| Thaps_hclust_0466 |
|
|
0.0000055 |
0.000014 |
0.0017 |
highlight_arrays | 0.018800 | -0.343 |
| Thaps_hclust_0466 |
|
|
0.0000055 |
0.000014 |
0.0017 |
diel_light_vs_dark | 0.787000 | -0.073 |
| Thaps_hclust_0466 |
|
|
0.0000055 |
0.000014 |
0.0017 |
lowFe_KTKB_Day3 | 0.859000 | 0.0494 |
| Thaps_hclust_0466 |
|
|
0.0000055 |
0.000014 |
0.0017 |
lowFe_KTKB_Day5 | 0.772000 | 0.0661 |
| Thaps_hclust_0466 |
|
|
0.0000055 |
0.000014 |
0.0017 |
BaP | 0.097300 | -0.33 |
| Thaps_hclust_0466 |
|
|
0.0000055 |
0.000014 |
0.0017 |
exponential_vs_stationary_24highlight | 0.300000 | 0.108 |
| Thaps_hclust_0466 |
|
|
0.0000055 |
0.000014 |
0.0017 |
co2_elevated_stat_arrays | 0.410000 | -0.191 |
| Thaps_hclust_0466 |
|
|
0.0000055 |
0.000014 |
0.0017 |
lowtemp_TMEVA | 0.119000 | 0.376 |
| Thaps_hclust_0466 |
|
|
0.0000055 |
0.000014 |
0.0017 |
highpH_TMEVA | 0.010800 | -0.394 |
| Thaps_hclust_0466 |
|
|
0.0000055 |
0.000014 |
0.0017 |
co2_elevated_expo_arrays | 0.323000 | 0.168 |
| Title | Cluster Plot | Dendrogram | e-value | e-value | e-value | Condition | Condition FDR | Condition Difference |
|---|---|---|---|---|---|---|---|---|
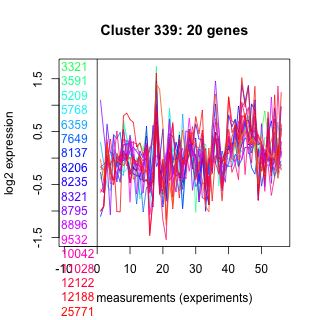
| Thaps_hclust_0339 |
 |
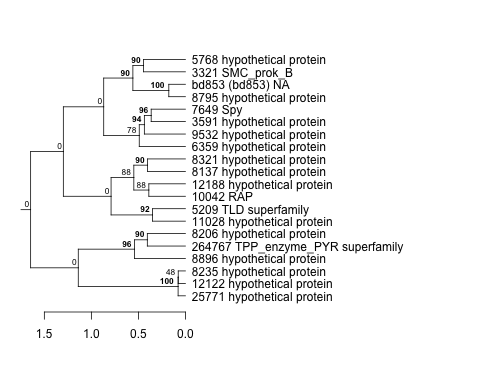 |
0.000016 |
0.00038 |
0.0017 |
lowtemp_TMEVA | 0.811000 | -0.0718 |
| Thaps_hclust_0339 |
|
|
0.000016 |
0.00038 |
0.0017 |
highpH_TMEVA | 0.043600 | -0.324 |
| Thaps_hclust_0339 |
|
|
0.000016 |
0.00038 |
0.0017 |
co2_elevated_expo_arrays | 0.985000 | -0.0171 |
| Thaps_hclust_0339 |
|
|
0.000016 |
0.00038 |
0.0017 |
lowFe_TMEVA | 0.111000 | -0.41 |
| Thaps_hclust_0339 |
|
|
0.000016 |
0.00038 |
0.0017 |
exponential_vs_stationary_24light | 0.388000 | -0.286 |
| Thaps_hclust_0339 |
|
|
0.000016 |
0.00038 |
0.0017 |
lowN_TMEVA | 0.861000 | 0.0668 |
| Thaps_hclust_0339 |
|
|
0.000016 |
0.00038 |
0.0017 |
diel_exponential_vs_stationary | 0.716000 | -0.078 |
| Thaps_hclust_0339 |
|
|
0.000016 |
0.00038 |
0.0017 |
lowSi_TMEVA | 0.812000 | -0.243 |
| Thaps_hclust_0339 |
|
|
0.000016 |
0.00038 |
0.0017 |
highlight_arrays | 0.027500 | 0.34 |
| Thaps_hclust_0339 |
|
|
0.000016 |
0.00038 |
0.0017 |
diel_light_vs_dark | 0.694000 | -0.103 |
| Thaps_hclust_0339 |
|
|
0.000016 |
0.00038 |
0.0017 |
lowFe_KTKB_Day3 | 0.016500 | -0.524 |
| Thaps_hclust_0339 |
|
|
0.000016 |
0.00038 |
0.0017 |
lowFe_KTKB_Day5 | 0.178000 | -0.273 |
| Thaps_hclust_0339 |
|
|
0.000016 |
0.00038 |
0.0017 |
BaP | 0.796000 | -0.0689 |
| Thaps_hclust_0339 |
|
|
0.000016 |
0.00038 |
0.0017 |
exponential_vs_stationary_24highlight | 0.096000 | -0.178 |
| Thaps_hclust_0339 |
|
|
0.000016 |
0.00038 |
0.0017 |
co2_elevated_stat_arrays | 0.670000 | 0.116 |
| Title | Cluster Plot | Dendrogram | e-value | e-value | e-value | Condition | Condition FDR | Condition Difference |
|---|---|---|---|---|---|---|---|---|
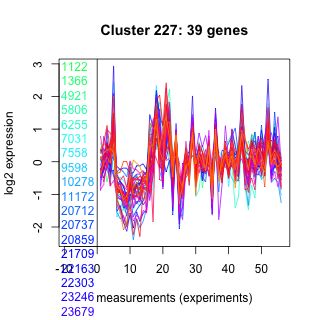
| Thaps_hclust_0227 |
 |
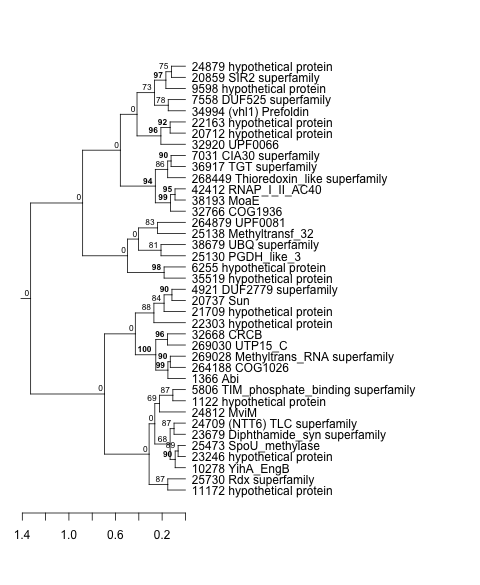 |
1.2e-22 |
0.0000000098 |
0.0018 |
co2_elevated_expo_arrays | 0.985000 | -0.0139 |
| Thaps_hclust_0227 |
|
|
1.2e-22 |
0.0000000098 |
0.0018 |
lowFe_TMEVA | 0.975000 | 0.0176 |
| Thaps_hclust_0227 |
|
|
1.2e-22 |
0.0000000098 |
0.0018 |
exponential_vs_stationary_24light | 0.365000 | -0.238 |
| Thaps_hclust_0227 |
|
|
1.2e-22 |
0.0000000098 |
0.0018 |
lowN_TMEVA | 0.356000 | 0.263 |
| Thaps_hclust_0227 |
|
|
1.2e-22 |
0.0000000098 |
0.0018 |
diel_exponential_vs_stationary | 0.454000 | -0.108 |
| Title | Cluster Plot | Dendrogram | e-value | e-value | e-value | Condition | Condition FDR | Condition Difference |
|---|---|---|---|---|---|---|---|---|
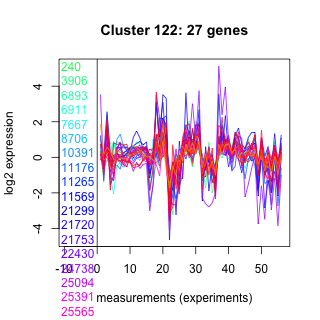
| Thaps_hclust_0122 |
 |
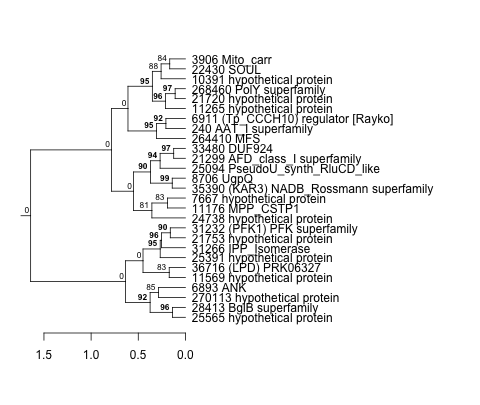 |
0.0000037 |
0.061 |
0.0018 |
highlight_arrays | 0.000442 | 0.655 |
| Thaps_hclust_0122 |
|
|
0.0000037 |
0.061 |
0.0018 |
diel_light_vs_dark | 0.053000 | 0.324 |
| Thaps_hclust_0122 |
|
|
0.0000037 |
0.061 |
0.0018 |
lowFe_KTKB_Day3 | 0.000862 | -0.559 |
| Thaps_hclust_0122 |
|
|
0.0000037 |
0.061 |
0.0018 |
lowFe_KTKB_Day5 | 0.557000 | -0.112 |
| Thaps_hclust_0122 |
|
|
0.0000037 |
0.061 |
0.0018 |
BaP | 0.000370 | 0.798 |