Hierarchical Clusters
Displaying 301 - 400 of 7500
| Title | Cluster Plot | Dendrogram | e-value | e-value | e-value | Condition | Condition FDR | Condition Difference |
|---|---|---|---|---|---|---|---|---|
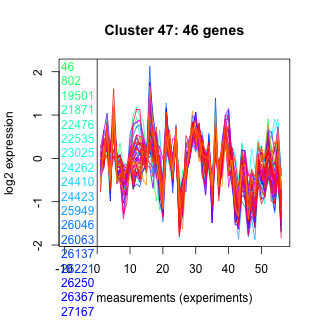
| Thaps_hclust_0028 |
 |
|
1.6e-27 |
6.8e-18 |
0.0000000000000078 |
co2_elevated_stat_arrays | 0.001190 | -0.393 |
| Thaps_hclust_0028 |
|
|
1.6e-27 |
6.8e-18 |
0.0000000000000078 |
lowtemp_TMEVA | 0.061100 | -0.254 |
| Thaps_hclust_0028 |
|
|
1.6e-27 |
6.8e-18 |
0.0000000000000078 |
highpH_TMEVA | 0.112000 | -0.152 |
| Thaps_hclust_0028 |
|
|
1.6e-27 |
6.8e-18 |
0.0000000000000078 |
co2_elevated_expo_arrays | 1.000000 | 0.00454 |
| Thaps_hclust_0028 |
|
|
1.6e-27 |
6.8e-18 |
0.0000000000000078 |
lowFe_TMEVA | 0.001040 | -0.401 |
| Thaps_hclust_0028 |
|
|
1.6e-27 |
6.8e-18 |
0.0000000000000078 |
exponential_vs_stationary_24light | 0.000581 | 1.51 |
| Thaps_hclust_0028 |
|
|
1.6e-27 |
6.8e-18 |
0.0000000000000078 |
lowN_TMEVA | 0.001190 | -0.933 |
| Thaps_hclust_0028 |
|
|
1.6e-27 |
6.8e-18 |
0.0000000000000078 |
diel_exponential_vs_stationary | 0.000602 | 0.543 |
| Thaps_hclust_0028 |
|
|
1.6e-27 |
6.8e-18 |
0.0000000000000078 |
lowSi_TMEVA | 0.001350 | -0.821 |
| Thaps_hclust_0028 |
|
|
1.6e-27 |
6.8e-18 |
0.0000000000000078 |
highlight_arrays | 0.000442 | -0.441 |
| Thaps_hclust_0028 |
|
|
1.6e-27 |
6.8e-18 |
0.0000000000000078 |
diel_light_vs_dark | 0.000485 | 0.467 |
| Thaps_hclust_0028 |
|
|
1.6e-27 |
6.8e-18 |
0.0000000000000078 |
lowFe_KTKB_Day3 | 0.859000 | -0.0308 |
| Thaps_hclust_0028 |
|
|
1.6e-27 |
6.8e-18 |
0.0000000000000078 |
lowFe_KTKB_Day5 | 0.908000 | 0.0157 |
| Thaps_hclust_0028 |
|
|
1.6e-27 |
6.8e-18 |
0.0000000000000078 |
BaP | 0.080000 | -0.197 |
| Thaps_hclust_0028 |
|
|
1.6e-27 |
6.8e-18 |
0.0000000000000078 |
exponential_vs_stationary_24highlight | 0.000526 | 0.591 |
| Title | Cluster Plot | Dendrogram | e-value | e-value | e-value | Condition | Condition FDR | Condition Difference |
|---|---|---|---|---|---|---|---|---|
| Thaps_hclust_0047 |
 |
 |
3.4e-21 |
3.4e-17 |
5.5e-19 |
co2_elevated_stat_arrays | 0.475000 | 0.154 |
| Thaps_hclust_0047 |
|
|
3.4e-21 |
3.4e-17 |
5.5e-19 |
lowtemp_TMEVA | 0.000735 | 0.819 |
| Thaps_hclust_0047 |
|
|
3.4e-21 |
3.4e-17 |
5.5e-19 |
highpH_TMEVA | 0.167000 | -0.156 |
| Thaps_hclust_0047 |
|
|
3.4e-21 |
3.4e-17 |
5.5e-19 |
co2_elevated_expo_arrays | 0.001390 | -0.332 |
| Thaps_hclust_0047 |
|
|
3.4e-21 |
3.4e-17 |
5.5e-19 |
lowFe_TMEVA | 0.671000 | 0.125 |
| Thaps_hclust_0047 |
|
|
3.4e-21 |
3.4e-17 |
5.5e-19 |
exponential_vs_stationary_24light | 0.419000 | 0.206 |
| Thaps_hclust_0047 |
|
|
3.4e-21 |
3.4e-17 |
5.5e-19 |
lowN_TMEVA | 0.027100 | 0.476 |
| Thaps_hclust_0047 |
|
|
3.4e-21 |
3.4e-17 |
5.5e-19 |
diel_exponential_vs_stationary | 0.000602 | -0.383 |
| Thaps_hclust_0047 |
|
|
3.4e-21 |
3.4e-17 |
5.5e-19 |
lowSi_TMEVA | 0.590000 | -0.307 |
| Thaps_hclust_0047 |
|
|
3.4e-21 |
3.4e-17 |
5.5e-19 |
highlight_arrays | 0.000442 | -0.387 |
| Thaps_hclust_0047 |
|
|
3.4e-21 |
3.4e-17 |
5.5e-19 |
diel_light_vs_dark | 0.027200 | -0.286 |
| Thaps_hclust_0047 |
|
|
3.4e-21 |
3.4e-17 |
5.5e-19 |
lowFe_KTKB_Day3 | 0.000862 | 0.68 |
| Thaps_hclust_0047 |
|
|
3.4e-21 |
3.4e-17 |
5.5e-19 |
lowFe_KTKB_Day5 | 0.028600 | 0.273 |
| Thaps_hclust_0047 |
|
|
3.4e-21 |
3.4e-17 |
5.5e-19 |
BaP | 0.566000 | -0.0908 |
| Thaps_hclust_0047 |
|
|
3.4e-21 |
3.4e-17 |
5.5e-19 |
exponential_vs_stationary_24highlight | 0.008630 | 0.178 |
| Title | Cluster Plot | Dendrogram | e-value | e-value | e-value | Condition | Condition FDR | Condition Difference |
|---|---|---|---|---|---|---|---|---|
| Thaps_hclust_0063 |
 |
 |
9.8e-19 |
5.7e-17 |
8.2e-17 |
lowFe_KTKB_Day5 | 0.652000 | -0.0949 |
| Thaps_hclust_0063 |
|
|
9.8e-19 |
5.7e-17 |
8.2e-17 |
BaP | 0.343000 | 0.202 |
| Thaps_hclust_0063 |
|
|
9.8e-19 |
5.7e-17 |
8.2e-17 |
exponential_vs_stationary_24highlight | 0.000526 | 0.445 |
| Thaps_hclust_0063 |
|
|
9.8e-19 |
5.7e-17 |
8.2e-17 |
co2_elevated_stat_arrays | 0.000658 | 0.831 |
| Thaps_hclust_0063 |
|
|
9.8e-19 |
5.7e-17 |
8.2e-17 |
lowtemp_TMEVA | 0.001430 | 0.847 |
| Thaps_hclust_0063 |
|
|
9.8e-19 |
5.7e-17 |
8.2e-17 |
highpH_TMEVA | 0.000725 | -0.651 |
| Thaps_hclust_0063 |
|
|
9.8e-19 |
5.7e-17 |
8.2e-17 |
co2_elevated_expo_arrays | 0.001390 | 0.552 |
| Thaps_hclust_0063 |
|
|
9.8e-19 |
5.7e-17 |
8.2e-17 |
lowFe_TMEVA | 0.300000 | -0.284 |
| Thaps_hclust_0063 |
|
|
9.8e-19 |
5.7e-17 |
8.2e-17 |
exponential_vs_stationary_24light | 0.006670 | 0.772 |
| Thaps_hclust_0063 |
|
|
9.8e-19 |
5.7e-17 |
8.2e-17 |
lowN_TMEVA | 0.730000 | -0.133 |
| Thaps_hclust_0063 |
|
|
9.8e-19 |
5.7e-17 |
8.2e-17 |
diel_exponential_vs_stationary | 0.002530 | 0.529 |
| Thaps_hclust_0063 |
|
|
9.8e-19 |
5.7e-17 |
8.2e-17 |
lowSi_TMEVA | 0.997000 | -0.0904 |
| Thaps_hclust_0063 |
|
|
9.8e-19 |
5.7e-17 |
8.2e-17 |
highlight_arrays | 0.000442 | -0.919 |
| Thaps_hclust_0063 |
|
|
9.8e-19 |
5.7e-17 |
8.2e-17 |
diel_light_vs_dark | 0.000485 | -1.49 |
| Thaps_hclust_0063 |
|
|
9.8e-19 |
5.7e-17 |
8.2e-17 |
lowFe_KTKB_Day3 | 0.000862 | -2.08 |
| Title | Cluster Plot | Dendrogram | e-value | e-value | e-value | Condition | Condition FDR | Condition Difference |
|---|---|---|---|---|---|---|---|---|
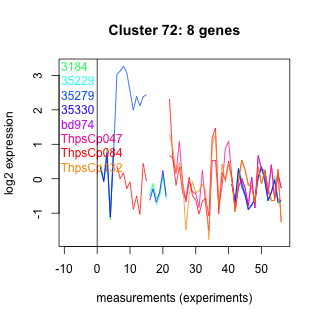
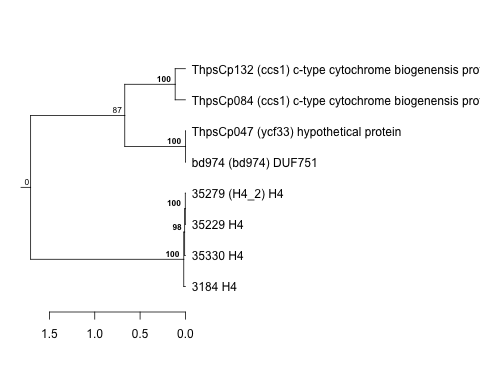
| Thaps_hclust_0072 |
 |
 |
1.2e-22 |
1.1e-16 |
0.000000000000011 |
exponential_vs_stationary_24light | 0.547000 | 0.307 |
| Thaps_hclust_0072 |
|
|
1.2e-22 |
1.1e-16 |
0.000000000000011 |
lowN_TMEVA | 0.120000 | 0.766 |
| Thaps_hclust_0072 |
|
|
1.2e-22 |
1.1e-16 |
0.000000000000011 |
diel_exponential_vs_stationary | 0.079000 | 0.513 |
| Thaps_hclust_0072 |
|
|
1.2e-22 |
1.1e-16 |
0.000000000000011 |
lowSi_TMEVA | 0.051200 | -1.14 |
| Thaps_hclust_0072 |
|
|
1.2e-22 |
1.1e-16 |
0.000000000000011 |
highlight_arrays | 0.502000 | -0.173 |
| Thaps_hclust_0072 |
|
|
1.2e-22 |
1.1e-16 |
0.000000000000011 |
diel_light_vs_dark | 0.629000 | -0.188 |
| Thaps_hclust_0072 |
|
|
1.2e-22 |
1.1e-16 |
0.000000000000011 |
lowFe_KTKB_Day3 | 0.157000 | -0.534 |
| Thaps_hclust_0072 |
|
|
1.2e-22 |
1.1e-16 |
0.000000000000011 |
lowFe_KTKB_Day5 | 0.501000 | -0.218 |
| Thaps_hclust_0072 |
|
|
1.2e-22 |
1.1e-16 |
0.000000000000011 |
BaP | 0.284000 | -0.374 |
| Thaps_hclust_0072 |
|
|
1.2e-22 |
1.1e-16 |
0.000000000000011 |
exponential_vs_stationary_24highlight | 0.035600 | 0.354 |
| Thaps_hclust_0072 |
|
|
1.2e-22 |
1.1e-16 |
0.000000000000011 |
co2_elevated_stat_arrays | 0.848000 | -0.0679 |
| Thaps_hclust_0072 |
|
|
1.2e-22 |
1.1e-16 |
0.000000000000011 |
lowtemp_TMEVA | 0.044600 | 0.856 |
| Thaps_hclust_0072 |
|
|
1.2e-22 |
1.1e-16 |
0.000000000000011 |
highpH_TMEVA | 0.131000 | 0.364 |
| Thaps_hclust_0072 |
|
|
1.2e-22 |
1.1e-16 |
0.000000000000011 |
co2_elevated_expo_arrays | 0.943000 | -0.0434 |
| Thaps_hclust_0072 |
|
|
1.2e-22 |
1.1e-16 |
0.000000000000011 |
lowFe_TMEVA | 0.899000 | -0.0587 |
| Title | Cluster Plot | Dendrogram | e-value | e-value | e-value | Condition | Condition FDR | Condition Difference |
|---|---|---|---|---|---|---|---|---|
| Thaps_hclust_0029 |
 |
|
9.1e-19 |
4.9e-16 |
0.00000000044 |
lowtemp_TMEVA | 0.015200 | 0.307 |
| Thaps_hclust_0029 |
|
|
9.1e-19 |
4.9e-16 |
0.00000000044 |
highpH_TMEVA | 0.555000 | -0.0651 |
| Thaps_hclust_0029 |
|
|
9.1e-19 |
4.9e-16 |
0.00000000044 |
co2_elevated_expo_arrays | 0.487000 | 0.101 |
| Thaps_hclust_0029 |
|
|
9.1e-19 |
4.9e-16 |
0.00000000044 |
lowFe_TMEVA | 0.001040 | -0.5 |
| Thaps_hclust_0029 |
|
|
9.1e-19 |
4.9e-16 |
0.00000000044 |
exponential_vs_stationary_24light | 0.000581 | 1.85 |
| Thaps_hclust_0029 |
|
|
9.1e-19 |
4.9e-16 |
0.00000000044 |
lowN_TMEVA | 0.001190 | -1.31 |
| Thaps_hclust_0029 |
|
|
9.1e-19 |
4.9e-16 |
0.00000000044 |
diel_exponential_vs_stationary | 0.000602 | 1.12 |
| Thaps_hclust_0029 |
|
|
9.1e-19 |
4.9e-16 |
0.00000000044 |
lowSi_TMEVA | 0.001350 | -1.16 |
| Thaps_hclust_0029 |
|
|
9.1e-19 |
4.9e-16 |
0.00000000044 |
highlight_arrays | 0.000442 | -0.866 |
| Thaps_hclust_0029 |
|
|
9.1e-19 |
4.9e-16 |
0.00000000044 |
diel_light_vs_dark | 0.557000 | -0.0749 |
| Thaps_hclust_0029 |
|
|
9.1e-19 |
4.9e-16 |
0.00000000044 |
lowFe_KTKB_Day3 | 0.000862 | 0.439 |
| Thaps_hclust_0029 |
|
|
9.1e-19 |
4.9e-16 |
0.00000000044 |
lowFe_KTKB_Day5 | 0.240000 | 0.119 |
| Thaps_hclust_0029 |
|
|
9.1e-19 |
4.9e-16 |
0.00000000044 |
BaP | 0.612000 | -0.0618 |
| Thaps_hclust_0029 |
|
|
9.1e-19 |
4.9e-16 |
0.00000000044 |
exponential_vs_stationary_24highlight | 0.000526 | 0.591 |
| Thaps_hclust_0029 |
|
|
9.1e-19 |
4.9e-16 |
0.00000000044 |
co2_elevated_stat_arrays | 0.838000 | 0.07 |
| Title | Cluster Plot | Dendrogram | e-value | e-value | e-value | Condition | Condition FDR | Condition Difference |
|---|---|---|---|---|---|---|---|---|
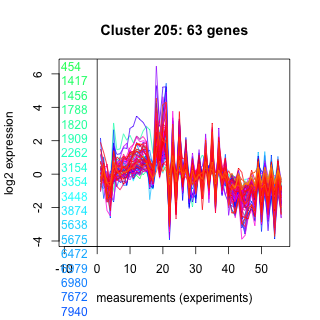
| Thaps_hclust_0205 |
 |
 |
2.3e-23 |
7.6e-16 |
0.00000015 |
lowN_TMEVA | 0.001190 | -0.696 |
| Thaps_hclust_0205 |
|
|
2.3e-23 |
7.6e-16 |
0.00000015 |
diel_exponential_vs_stationary | 0.914000 | 0.0153 |
| Thaps_hclust_0205 |
|
|
2.3e-23 |
7.6e-16 |
0.00000015 |
lowSi_TMEVA | 0.001350 | -0.925 |
| Thaps_hclust_0205 |
|
|
2.3e-23 |
7.6e-16 |
0.00000015 |
highlight_arrays | 0.000442 | -0.427 |
| Thaps_hclust_0205 |
|
|
2.3e-23 |
7.6e-16 |
0.00000015 |
diel_light_vs_dark | 0.000485 | 1.62 |
| Thaps_hclust_0205 |
|
|
2.3e-23 |
7.6e-16 |
0.00000015 |
lowFe_KTKB_Day3 | 0.453000 | 0.11 |
| Thaps_hclust_0205 |
|
|
2.3e-23 |
7.6e-16 |
0.00000015 |
lowFe_KTKB_Day5 | 0.978000 | 0.00427 |
| Thaps_hclust_0205 |
|
|
2.3e-23 |
7.6e-16 |
0.00000015 |
BaP | 0.000370 | 1.87 |
| Thaps_hclust_0205 |
|
|
2.3e-23 |
7.6e-16 |
0.00000015 |
exponential_vs_stationary_24highlight | 0.000526 | 0.396 |
| Thaps_hclust_0205 |
|
|
2.3e-23 |
7.6e-16 |
0.00000015 |
co2_elevated_stat_arrays | 0.778000 | -0.0836 |
| Thaps_hclust_0205 |
|
|
2.3e-23 |
7.6e-16 |
0.00000015 |
lowtemp_TMEVA | 0.012000 | 0.371 |
| Thaps_hclust_0205 |
|
|
2.3e-23 |
7.6e-16 |
0.00000015 |
highpH_TMEVA | 0.300000 | 0.11 |
| Thaps_hclust_0205 |
|
|
2.3e-23 |
7.6e-16 |
0.00000015 |
co2_elevated_expo_arrays | 0.282000 | 0.129 |
| Thaps_hclust_0205 |
|
|
2.3e-23 |
7.6e-16 |
0.00000015 |
lowFe_TMEVA | 0.810000 | 0.0887 |
| Thaps_hclust_0205 |
|
|
2.3e-23 |
7.6e-16 |
0.00000015 |
exponential_vs_stationary_24light | 0.000581 | 1.39 |
| Title | Cluster Plot | Dendrogram | e-value | e-value | e-value | Condition | Condition FDR | Condition Difference |
|---|---|---|---|---|---|---|---|---|
| Thaps_hclust_0312 |
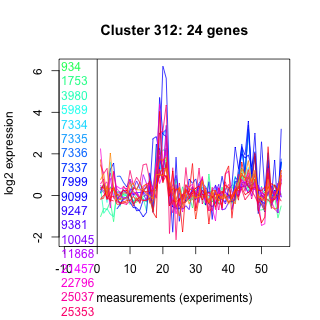 |
 |
1.6e-19 |
9.9e-16 |
0.000000000033 |
diel_exponential_vs_stationary | 0.441000 | -0.139 |
| Thaps_hclust_0312 |
|
|
1.6e-19 |
9.9e-16 |
0.000000000033 |
lowSi_TMEVA | 0.599000 | 0.334 |
| Thaps_hclust_0312 |
|
|
1.6e-19 |
9.9e-16 |
0.000000000033 |
highlight_arrays | 0.000442 | 0.559 |
| Thaps_hclust_0312 |
|
|
1.6e-19 |
9.9e-16 |
0.000000000033 |
diel_light_vs_dark | 0.785000 | 0.0722 |
| Thaps_hclust_0312 |
|
|
1.6e-19 |
9.9e-16 |
0.000000000033 |
lowFe_KTKB_Day3 | 0.157000 | 0.299 |
| Thaps_hclust_0312 |
|
|
1.6e-19 |
9.9e-16 |
0.000000000033 |
lowFe_KTKB_Day5 | 0.954000 | -0.014 |
| Thaps_hclust_0312 |
|
|
1.6e-19 |
9.9e-16 |
0.000000000033 |
BaP | 0.000370 | 1.75 |
| Thaps_hclust_0312 |
|
|
1.6e-19 |
9.9e-16 |
0.000000000033 |
exponential_vs_stationary_24highlight | 0.000526 | -0.59 |
| Thaps_hclust_0312 |
|
|
1.6e-19 |
9.9e-16 |
0.000000000033 |
co2_elevated_stat_arrays | 0.002130 | 0.596 |
| Thaps_hclust_0312 |
|
|
1.6e-19 |
9.9e-16 |
0.000000000033 |
lowtemp_TMEVA | 0.385000 | 0.208 |