Hierarchical Clusters
Displaying 601 - 700 of 28001
| Title | Cluster Plot | Dendrogram | e-value | e-value | e-value | Condition | Condition FDR | Condition Difference |
|---|---|---|---|---|---|---|---|---|
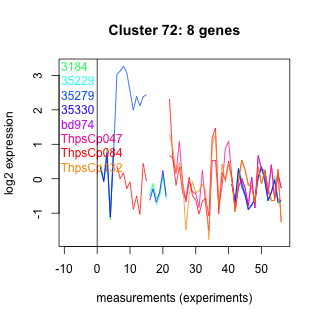
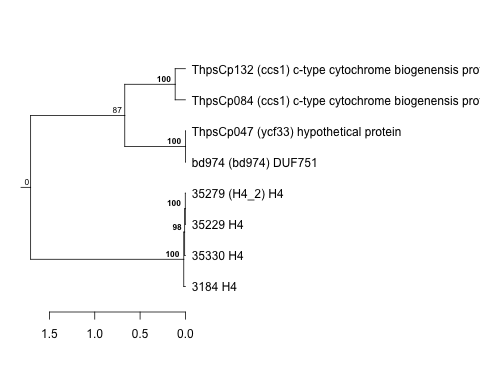
| Thaps_hclust_0072 |
 |
 |
1.2e-22 |
1.1e-16 |
0.000000000000011 |
co2_elevated_expo_arrays | 0.943000 | -0.0434 |
| Thaps_hclust_0072 |
|
|
1.2e-22 |
1.1e-16 |
0.000000000000011 |
lowFe_TMEVA | 0.899000 | -0.0587 |
| Thaps_hclust_0072 |
|
|
1.2e-22 |
1.1e-16 |
0.000000000000011 |
exponential_vs_stationary_24light | 0.547000 | 0.307 |
| Thaps_hclust_0072 |
|
|
1.2e-22 |
1.1e-16 |
0.000000000000011 |
lowN_TMEVA | 0.120000 | 0.766 |
| Thaps_hclust_0072 |
|
|
1.2e-22 |
1.1e-16 |
0.000000000000011 |
diel_exponential_vs_stationary | 0.079000 | 0.513 |
| Thaps_hclust_0072 |
|
|
1.2e-22 |
1.1e-16 |
0.000000000000011 |
lowSi_TMEVA | 0.051200 | -1.14 |
| Thaps_hclust_0072 |
|
|
1.2e-22 |
1.1e-16 |
0.000000000000011 |
highlight_arrays | 0.502000 | -0.173 |
| Title | Cluster Plot | Dendrogram | e-value | e-value | e-value | Condition | Condition FDR | Condition Difference |
|---|---|---|---|---|---|---|---|---|
| Thaps_hclust_0029 |
 |
|
9.1e-19 |
4.9e-16 |
0.00000000044 |
diel_light_vs_dark | 0.557000 | -0.0749 |
| Thaps_hclust_0029 |
|
|
9.1e-19 |
4.9e-16 |
0.00000000044 |
lowFe_KTKB_Day3 | 0.000862 | 0.439 |
| Thaps_hclust_0029 |
|
|
9.1e-19 |
4.9e-16 |
0.00000000044 |
lowFe_KTKB_Day5 | 0.240000 | 0.119 |
| Thaps_hclust_0029 |
|
|
9.1e-19 |
4.9e-16 |
0.00000000044 |
BaP | 0.612000 | -0.0618 |
| Thaps_hclust_0029 |
|
|
9.1e-19 |
4.9e-16 |
0.00000000044 |
exponential_vs_stationary_24highlight | 0.000526 | 0.591 |
| Thaps_hclust_0029 |
|
|
9.1e-19 |
4.9e-16 |
0.00000000044 |
co2_elevated_stat_arrays | 0.838000 | 0.07 |
| Thaps_hclust_0029 |
|
|
9.1e-19 |
4.9e-16 |
0.00000000044 |
lowtemp_TMEVA | 0.015200 | 0.307 |
| Thaps_hclust_0029 |
|
|
9.1e-19 |
4.9e-16 |
0.00000000044 |
highpH_TMEVA | 0.555000 | -0.0651 |
| Thaps_hclust_0029 |
|
|
9.1e-19 |
4.9e-16 |
0.00000000044 |
co2_elevated_expo_arrays | 0.487000 | 0.101 |
| Thaps_hclust_0029 |
|
|
9.1e-19 |
4.9e-16 |
0.00000000044 |
lowFe_TMEVA | 0.001040 | -0.5 |
| Thaps_hclust_0029 |
|
|
9.1e-19 |
4.9e-16 |
0.00000000044 |
exponential_vs_stationary_24light | 0.000581 | 1.85 |
| Thaps_hclust_0029 |
|
|
9.1e-19 |
4.9e-16 |
0.00000000044 |
lowN_TMEVA | 0.001190 | -1.31 |
| Thaps_hclust_0029 |
|
|
9.1e-19 |
4.9e-16 |
0.00000000044 |
diel_exponential_vs_stationary | 0.000602 | 1.12 |
| Thaps_hclust_0029 |
|
|
9.1e-19 |
4.9e-16 |
0.00000000044 |
lowSi_TMEVA | 0.001350 | -1.16 |
| Thaps_hclust_0029 |
|
|
9.1e-19 |
4.9e-16 |
0.00000000044 |
highlight_arrays | 0.000442 | -0.866 |
| Title | Cluster Plot | Dendrogram | e-value | e-value | e-value | Condition | Condition FDR | Condition Difference |
|---|---|---|---|---|---|---|---|---|
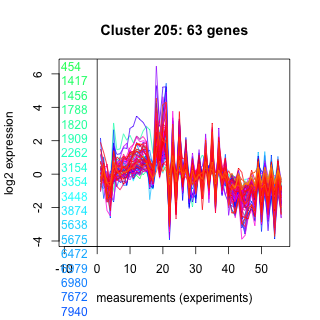
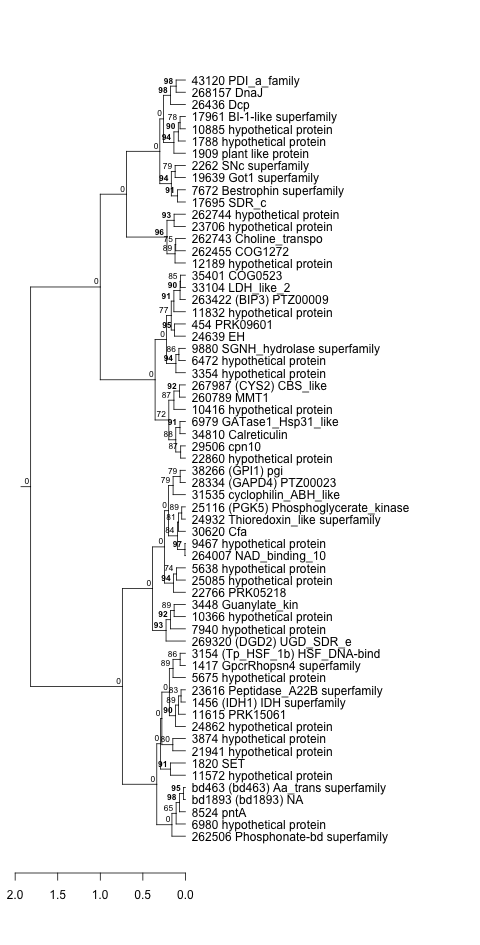
| Thaps_hclust_0205 |
 |
 |
2.3e-23 |
7.6e-16 |
0.00000015 |
diel_light_vs_dark | 0.000485 | 1.62 |
| Thaps_hclust_0205 |
|
|
2.3e-23 |
7.6e-16 |
0.00000015 |
lowFe_KTKB_Day3 | 0.453000 | 0.11 |
| Thaps_hclust_0205 |
|
|
2.3e-23 |
7.6e-16 |
0.00000015 |
lowFe_KTKB_Day5 | 0.978000 | 0.00427 |
| Thaps_hclust_0205 |
|
|
2.3e-23 |
7.6e-16 |
0.00000015 |
BaP | 0.000370 | 1.87 |
| Thaps_hclust_0205 |
|
|
2.3e-23 |
7.6e-16 |
0.00000015 |
exponential_vs_stationary_24highlight | 0.000526 | 0.396 |
| Thaps_hclust_0205 |
|
|
2.3e-23 |
7.6e-16 |
0.00000015 |
co2_elevated_stat_arrays | 0.778000 | -0.0836 |
| Thaps_hclust_0205 |
|
|
2.3e-23 |
7.6e-16 |
0.00000015 |
lowtemp_TMEVA | 0.012000 | 0.371 |
| Thaps_hclust_0205 |
|
|
2.3e-23 |
7.6e-16 |
0.00000015 |
highpH_TMEVA | 0.300000 | 0.11 |
| Thaps_hclust_0205 |
|
|
2.3e-23 |
7.6e-16 |
0.00000015 |
co2_elevated_expo_arrays | 0.282000 | 0.129 |
| Thaps_hclust_0205 |
|
|
2.3e-23 |
7.6e-16 |
0.00000015 |
lowFe_TMEVA | 0.810000 | 0.0887 |
| Thaps_hclust_0205 |
|
|
2.3e-23 |
7.6e-16 |
0.00000015 |
exponential_vs_stationary_24light | 0.000581 | 1.39 |
| Thaps_hclust_0205 |
|
|
2.3e-23 |
7.6e-16 |
0.00000015 |
lowN_TMEVA | 0.001190 | -0.696 |
| Thaps_hclust_0205 |
|
|
2.3e-23 |
7.6e-16 |
0.00000015 |
diel_exponential_vs_stationary | 0.914000 | 0.0153 |
| Thaps_hclust_0205 |
|
|
2.3e-23 |
7.6e-16 |
0.00000015 |
lowSi_TMEVA | 0.001350 | -0.925 |
| Thaps_hclust_0205 |
|
|
2.3e-23 |
7.6e-16 |
0.00000015 |
highlight_arrays | 0.000442 | -0.427 |
| Title | Cluster Plot | Dendrogram | e-value | e-value | e-value | Condition | Condition FDR | Condition Difference |
|---|---|---|---|---|---|---|---|---|
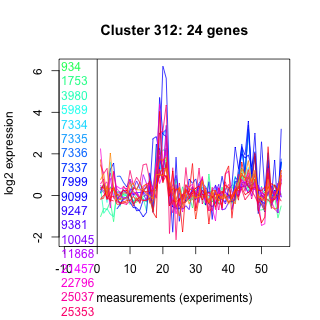
| Thaps_hclust_0312 |
 |
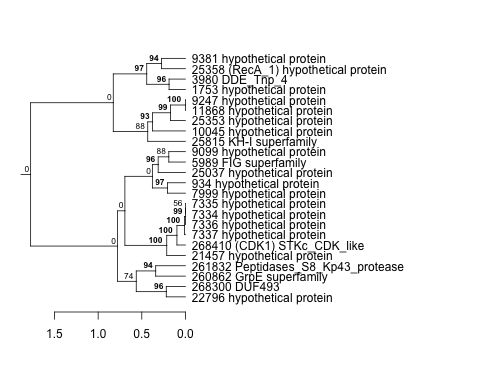 |
1.6e-19 |
9.9e-16 |
0.000000000033 |
diel_light_vs_dark | 0.785000 | 0.0722 |
| Thaps_hclust_0312 |
|
|
1.6e-19 |
9.9e-16 |
0.000000000033 |
lowFe_KTKB_Day3 | 0.157000 | 0.299 |
| Thaps_hclust_0312 |
|
|
1.6e-19 |
9.9e-16 |
0.000000000033 |
lowFe_KTKB_Day5 | 0.954000 | -0.014 |
| Thaps_hclust_0312 |
|
|
1.6e-19 |
9.9e-16 |
0.000000000033 |
BaP | 0.000370 | 1.75 |
| Thaps_hclust_0312 |
|
|
1.6e-19 |
9.9e-16 |
0.000000000033 |
exponential_vs_stationary_24highlight | 0.000526 | -0.59 |
| Thaps_hclust_0312 |
|
|
1.6e-19 |
9.9e-16 |
0.000000000033 |
co2_elevated_stat_arrays | 0.002130 | 0.596 |
| Thaps_hclust_0312 |
|
|
1.6e-19 |
9.9e-16 |
0.000000000033 |
lowtemp_TMEVA | 0.385000 | 0.208 |
| Thaps_hclust_0312 |
|
|
1.6e-19 |
9.9e-16 |
0.000000000033 |
highpH_TMEVA | 0.000725 | 0.497 |
| Thaps_hclust_0312 |
|
|
1.6e-19 |
9.9e-16 |
0.000000000033 |
co2_elevated_expo_arrays | 0.660000 | 0.106 |
| Thaps_hclust_0312 |
|
|
1.6e-19 |
9.9e-16 |
0.000000000033 |
lowFe_TMEVA | 0.249000 | 0.296 |
| Thaps_hclust_0312 |
|
|
1.6e-19 |
9.9e-16 |
0.000000000033 |
exponential_vs_stationary_24light | 0.019000 | -0.641 |
| Thaps_hclust_0312 |
|
|
1.6e-19 |
9.9e-16 |
0.000000000033 |
lowN_TMEVA | 0.861000 | 0.0571 |
| Thaps_hclust_0312 |
|
|
1.6e-19 |
9.9e-16 |
0.000000000033 |
diel_exponential_vs_stationary | 0.441000 | -0.139 |
| Thaps_hclust_0312 |
|
|
1.6e-19 |
9.9e-16 |
0.000000000033 |
lowSi_TMEVA | 0.599000 | 0.334 |
| Thaps_hclust_0312 |
|
|
1.6e-19 |
9.9e-16 |
0.000000000033 |
highlight_arrays | 0.000442 | 0.559 |
| Title | Cluster Plot | Dendrogram | e-value | e-value | e-value | Condition | Condition FDR | Condition Difference |
|---|---|---|---|---|---|---|---|---|
| Thaps_hclust_0255 |
 |
 |
1.4e-28 |
0.0000000000000024 |
0.000000029 |
diel_light_vs_dark | 0.000485 | -0.853 |
| Thaps_hclust_0255 |
|
|
1.4e-28 |
0.0000000000000024 |
0.000000029 |
lowFe_KTKB_Day3 | 1.000000 | |
| Thaps_hclust_0255 |
|
|
1.4e-28 |
0.0000000000000024 |
0.000000029 |
lowFe_KTKB_Day5 | 1.000000 | |
| Thaps_hclust_0255 |
|
|
1.4e-28 |
0.0000000000000024 |
0.000000029 |
BaP | 1.000000 | |
| Thaps_hclust_0255 |
|
|
1.4e-28 |
0.0000000000000024 |
0.000000029 |
exponential_vs_stationary_24highlight | 0.002870 | -0.36 |
| Thaps_hclust_0255 |
|
|
1.4e-28 |
0.0000000000000024 |
0.000000029 |
co2_elevated_stat_arrays | 0.006310 | 0.6 |
| Thaps_hclust_0255 |
|
|
1.4e-28 |
0.0000000000000024 |
0.000000029 |
lowtemp_TMEVA | 1.000000 | |
| Thaps_hclust_0255 |
|
|
1.4e-28 |
0.0000000000000024 |
0.000000029 |
highpH_TMEVA | 1.000000 | |
| Thaps_hclust_0255 |
|
|
1.4e-28 |
0.0000000000000024 |
0.000000029 |
co2_elevated_expo_arrays | 0.903000 | 0.0569 |
| Thaps_hclust_0255 |
|
|
1.4e-28 |
0.0000000000000024 |
0.000000029 |
lowFe_TMEVA | 1.000000 | |
| Thaps_hclust_0255 |
|
|
1.4e-28 |
0.0000000000000024 |
0.000000029 |
exponential_vs_stationary_24light | 0.576000 | 0.224 |
| Thaps_hclust_0255 |
|
|
1.4e-28 |
0.0000000000000024 |
0.000000029 |
lowN_TMEVA | 1.000000 | |
| Thaps_hclust_0255 |
|
|
1.4e-28 |
0.0000000000000024 |
0.000000029 |
diel_exponential_vs_stationary | 0.010200 | 0.533 |
| Thaps_hclust_0255 |
|
|
1.4e-28 |
0.0000000000000024 |
0.000000029 |
lowSi_TMEVA | 1.000000 | |
| Thaps_hclust_0255 |
|
|
1.4e-28 |
0.0000000000000024 |
0.000000029 |
highlight_arrays | 0.000442 | -1.16 |
| Title | Cluster Plot | Dendrogram | e-value | e-value | e-value | Condition | Condition FDR | Condition Difference |
|---|---|---|---|---|---|---|---|---|
| Thaps_hclust_0208 |
 |
|
1.2e-20 |
0.0000000000000057 |
0.0000000099 |
diel_light_vs_dark | 0.000485 | 0.714 |
| Thaps_hclust_0208 |
|
|
1.2e-20 |
0.0000000000000057 |
0.0000000099 |
lowFe_KTKB_Day3 | 0.968000 | -0.00748 |
| Thaps_hclust_0208 |
|
|
1.2e-20 |
0.0000000000000057 |
0.0000000099 |
lowFe_KTKB_Day5 | 0.561000 | -0.0717 |
| Thaps_hclust_0208 |
|
|
1.2e-20 |
0.0000000000000057 |
0.0000000099 |
BaP | 0.000370 | 0.466 |
| Thaps_hclust_0208 |
|
|
1.2e-20 |
0.0000000000000057 |
0.0000000099 |
exponential_vs_stationary_24highlight | 0.000526 | 0.404 |
| Thaps_hclust_0208 |
|
|
1.2e-20 |
0.0000000000000057 |
0.0000000099 |
co2_elevated_stat_arrays | 0.000658 | -0.474 |
| Thaps_hclust_0208 |
|
|
1.2e-20 |
0.0000000000000057 |
0.0000000099 |
lowtemp_TMEVA | 0.800000 | 0.0444 |
| Thaps_hclust_0208 |
|
|
1.2e-20 |
0.0000000000000057 |
0.0000000099 |
highpH_TMEVA | 0.329000 | 0.102 |
| Thaps_hclust_0208 |
|
|
1.2e-20 |
0.0000000000000057 |
0.0000000099 |
co2_elevated_expo_arrays | 0.985000 | -0.014 |
| Thaps_hclust_0208 |
|
|
1.2e-20 |
0.0000000000000057 |
0.0000000099 |
lowFe_TMEVA | 0.996000 | -0.00415 |
| Thaps_hclust_0208 |
|
|
1.2e-20 |
0.0000000000000057 |
0.0000000099 |
exponential_vs_stationary_24light | 0.000581 | 0.911 |
| Thaps_hclust_0208 |
|
|
1.2e-20 |
0.0000000000000057 |
0.0000000099 |
lowN_TMEVA | 0.001190 | -0.59 |
| Thaps_hclust_0208 |
|
|
1.2e-20 |
0.0000000000000057 |
0.0000000099 |
diel_exponential_vs_stationary | 0.099000 | 0.161 |
| Thaps_hclust_0208 |
|
|
1.2e-20 |
0.0000000000000057 |
0.0000000099 |
lowSi_TMEVA | 0.445000 | -0.334 |
| Thaps_hclust_0208 |
|
|
1.2e-20 |
0.0000000000000057 |
0.0000000099 |
highlight_arrays | 0.002290 | -0.269 |
| Title | Cluster Plot | Dendrogram | e-value | e-value | e-value | Condition | Condition FDR | Condition Difference |
|---|---|---|---|---|---|---|---|---|
| Thaps_hclust_0099 |
 |
 |
0.0000000000000032 |
0.000000000000013 |
0.000000000000025 |
diel_light_vs_dark | 0.152000 | -0.59 |
| Thaps_hclust_0099 |
|
|
0.0000000000000032 |
0.000000000000013 |
0.000000000000025 |
lowFe_KTKB_Day3 | 0.887000 | 0.0802 |
| Thaps_hclust_0099 |
|
|
0.0000000000000032 |
0.000000000000013 |
0.000000000000025 |
lowFe_KTKB_Day5 | 0.284000 | -0.427 |
| Thaps_hclust_0099 |
|
|
0.0000000000000032 |
0.000000000000013 |
0.000000000000025 |
BaP | 0.183000 | -0.581 |
| Thaps_hclust_0099 |
|
|
0.0000000000000032 |
0.000000000000013 |
0.000000000000025 |
exponential_vs_stationary_24highlight | 0.000526 | 0.919 |
| Thaps_hclust_0099 |
|
|
0.0000000000000032 |
0.000000000000013 |
0.000000000000025 |
co2_elevated_stat_arrays | 0.070300 | 0.686 |
| Thaps_hclust_0099 |
|
|
0.0000000000000032 |
0.000000000000013 |
0.000000000000025 |
lowtemp_TMEVA | 0.020700 | -1.41 |
| Thaps_hclust_0099 |
|
|
0.0000000000000032 |
0.000000000000013 |
0.000000000000025 |
highpH_TMEVA | 0.053300 | 0.615 |
| Thaps_hclust_0099 |
|
|
0.0000000000000032 |
0.000000000000013 |
0.000000000000025 |
co2_elevated_expo_arrays | 1.000000 | -0.00337 |
| Thaps_hclust_0099 |
|
|
0.0000000000000032 |
0.000000000000013 |
0.000000000000025 |
lowFe_TMEVA | 0.216000 | -0.629 |
| Thaps_hclust_0099 |
|
|
0.0000000000000032 |
0.000000000000013 |
0.000000000000025 |
exponential_vs_stationary_24light | 0.055600 | 1.17 |
| Thaps_hclust_0099 |
|
|
0.0000000000000032 |
0.000000000000013 |
0.000000000000025 |
lowN_TMEVA | 0.027400 | -1.48 |
| Thaps_hclust_0099 |
|
|
0.0000000000000032 |
0.000000000000013 |
0.000000000000025 |
diel_exponential_vs_stationary | 0.837000 | 0.0789 |
| Thaps_hclust_0099 |
|
|
0.0000000000000032 |
0.000000000000013 |
0.000000000000025 |
lowSi_TMEVA | 0.021200 | -1.72 |
| Thaps_hclust_0099 |
|
|
0.0000000000000032 |
0.000000000000013 |
0.000000000000025 |
highlight_arrays | 0.036900 | 0.656 |
| Title | Cluster Plot | Dendrogram | e-value | e-value | e-value | Condition | Condition FDR | Condition Difference |
|---|---|---|---|---|---|---|---|---|
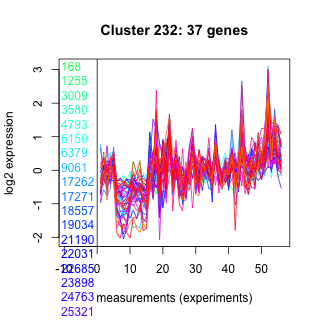
| Thaps_hclust_0232 |
 |
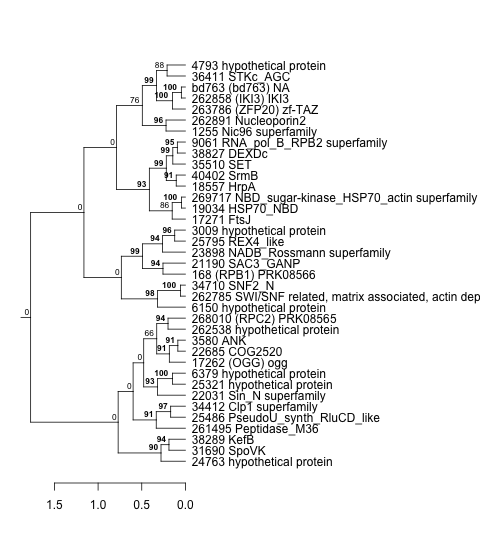 |
9.2e-16 |
0.000000000000019 |
0.35 |
diel_light_vs_dark | 0.240000 | -0.186 |
| Thaps_hclust_0232 |
|
|
9.2e-16 |
0.000000000000019 |
0.35 |
lowFe_KTKB_Day3 | 0.779000 | 0.0616 |
| Thaps_hclust_0232 |
|
|
9.2e-16 |
0.000000000000019 |
0.35 |
lowFe_KTKB_Day5 | 0.849000 | -0.033 |