Thaps_bicluster_0140 Residual: 0.29
Thalassiosira pseudonana
| Title | Residual | Model version | Organism |
|---|---|---|---|
| Thaps_bicluster_0140 | 0.29 | Thalassiosira pseudonana |
" class="views-fluidgrid-wrapper clear-block">
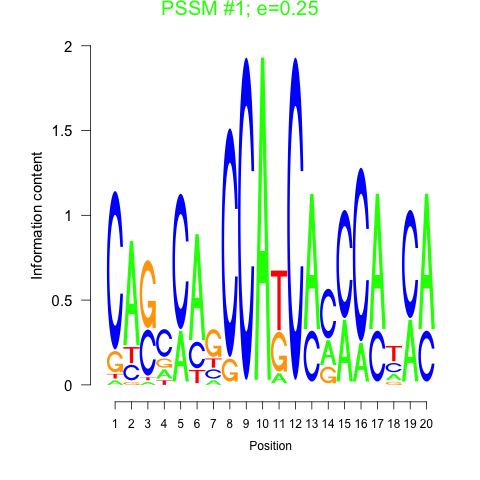
Motif 1 
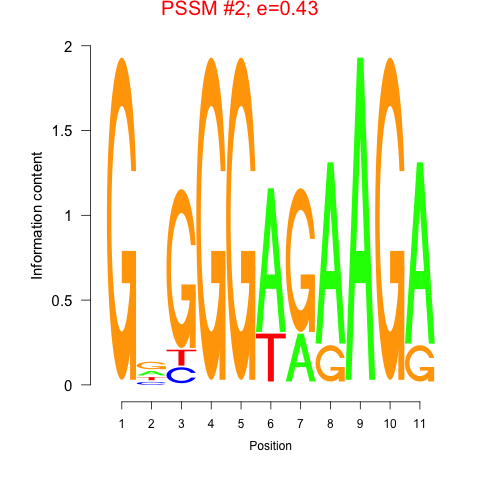
Motif 2 
Displaying 1 - 22 of 22
" class="views-fluidgrid-wrapper clear-block">
10416 hypothetical protein
10885 hypothetical protein
11832 hypothetical protein
1926 hypothetical protein
21978 hypothetical protein
25724 AIM24
262610 ADPRase_NUDT5
262819 TPR
263422 (BIP3) PTZ00009
3071 NA
33104 LDH_like_2
3354 hypothetical protein
34810 Calreticulin
35036 DER1 superfamily
35401 COG0523
3730 hypothetical protein
38191 (HSP60) groEL
4130 hypothetical protein
454 PRK09601
6209 Amidohydro_2
6979 GATase1_Hsp31_like
8349 NADB_Rossmann superfamily
| GO ID | Go Term | p-value | q-value | Cluster |
|---|---|---|---|---|
| GO:0006564 | L-serine biosynthesis | 0.00742418 | 1 | Thaps_bicluster_0140 |
| GO:0044267 | cellular protein metabolism | 0.0115308 | 1 | Thaps_bicluster_0140 |
| GO:0006457 | protein folding | 0.103279 | 1 | Thaps_bicluster_0140 |
| GO:0008152 | metabolism | 0.296505 | 1 | Thaps_bicluster_0140 |
Comments