Thaps_bicluster_0204 Residual: 0.18
Thalassiosira pseudonana
| Title | Residual | Model version | Organism |
|---|---|---|---|
| Thaps_bicluster_0204 | 0.18 | Thalassiosira pseudonana |
" class="views-fluidgrid-wrapper clear-block">
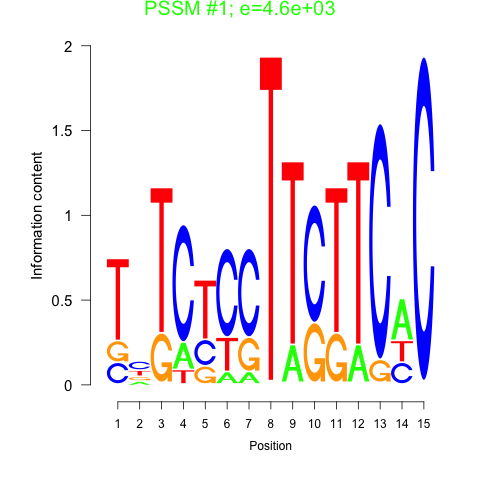
Motif 1 
Motif 2 

Displaying 1 - 14 of 14
" class="views-fluidgrid-wrapper clear-block">
12695 Glucan_synthase superfamily
1953 hypothetical protein
21517 Methyltransf_6 superfamily
23283 hypothetical protein
25892 PLN03116
262674 NADB_Rossmann superfamily
264865 (Tp_CSF4) CSP_CDS
31383 (GAPD1) GapA
35878 PLN02307
40156 F1-ATPase_gamma
42326 PLN02830
4914 PLN03116
5434 hypothetical protein
7881 hypothetical protein
| GO ID | Go Term | p-value | q-value | Cluster |
|---|---|---|---|---|
| GO:0006075 | beta-1,3 glucan biosynthesis | 0.00268762 | 1 | Thaps_bicluster_0204 |
| GO:0006816 | calcium ion transport | 0.016026 | 1 | Thaps_bicluster_0204 |
| GO:0006006 | glucose metabolism | 0.0265779 | 1 | Thaps_bicluster_0204 |
| GO:0006306 | DNA methylation | 0.075288 | 1 | Thaps_bicluster_0204 |
| GO:0006096 | glycolysis | 0.0951161 | 1 | Thaps_bicluster_0204 |
| GO:0006812 | cation transport | 0.109729 | 1 | Thaps_bicluster_0204 |
| GO:0015986 | ATP synthesis coupled proton transport | 0.116953 | 1 | Thaps_bicluster_0204 |
| GO:0006118 | electron transport | 0.157847 | 1 | Thaps_bicluster_0204 |
| GO:0005975 | carbohydrate metabolism | 0.184052 | 1 | Thaps_bicluster_0204 |
| GO:0008152 | metabolism | 0.300056 | 1 | Thaps_bicluster_0204 |
Comments