Thaps_bicluster_0237 Residual: 0.26
Thalassiosira pseudonana
| Title | Residual | Model version | Organism |
|---|---|---|---|
| Thaps_bicluster_0237 | 0.26 | Thalassiosira pseudonana |
" class="views-fluidgrid-wrapper clear-block">
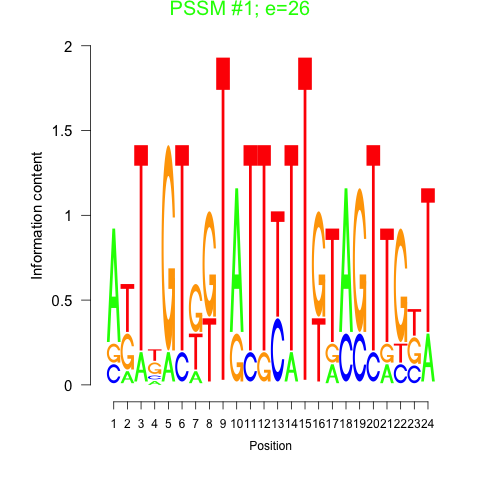
Motif 1 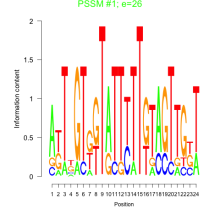
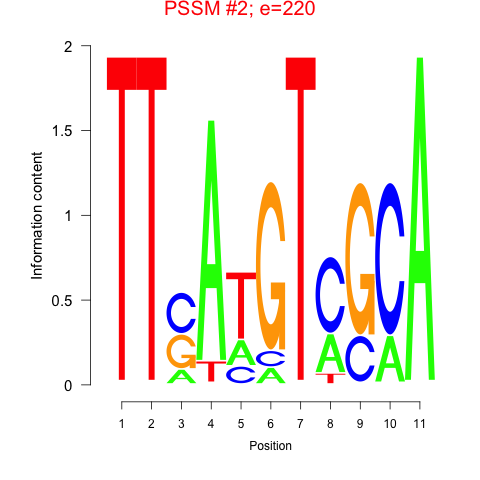
Motif 2 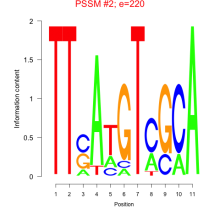
Displaying 1 - 15 of 15
" class="views-fluidgrid-wrapper clear-block">
10234 PLN00093
1967 hypothetical protein
20965 hypothetical protein
21748 (ALDO2) FBP_aldolase_IIA
24669 hypothetical protein
264714 Chloroa_b-bind superfamily
26573 (ChlH1) PLN03069
2673 Rieske
268621 (PGM2) PLN02307
283 FHIT
31128 (lhcx5) Chloroa_b-bind
33891 (Tp_sigma70.4) Sig70-cyanoRpoD
38512 Abhydrolase_6
6770 (ACC) Carboxyl_trans
866 S14_ClpP_2
| GO ID | Go Term | p-value | q-value | Cluster |
|---|---|---|---|---|
| GO:0009765 | photosynthesis light harvesting | 0.00654158 | 1 | Thaps_bicluster_0237 |
| GO:0015995 | chlorophyll biosynthesis | 0.0123506 | 1 | Thaps_bicluster_0237 |
| GO:0015979 | photosynthesis | 0.0396209 | 1 | Thaps_bicluster_0237 |
| GO:0006352 | transcription initiation | 0.0396209 | 1 | Thaps_bicluster_0237 |
| GO:0006725 | aromatic compound metabolism | 0.066187 | 1 | Thaps_bicluster_0237 |
| GO:0006096 | glycolysis | 0.108945 | 1 | Thaps_bicluster_0237 |
| GO:0009058 | biosynthesis | 0.157842 | 1 | Thaps_bicluster_0237 |
| GO:0006118 | electron transport | 0.198115 | 1 | Thaps_bicluster_0237 |
| GO:0005975 | carbohydrate metabolism | 0.209229 | 1 | Thaps_bicluster_0237 |
| GO:0008152 | metabolism | 0.363828 | 1 | Thaps_bicluster_0237 |
Comments