motif_0035_1
Submitted by Anonymous (not verified) on Wed, 05/20/2015 - 14:16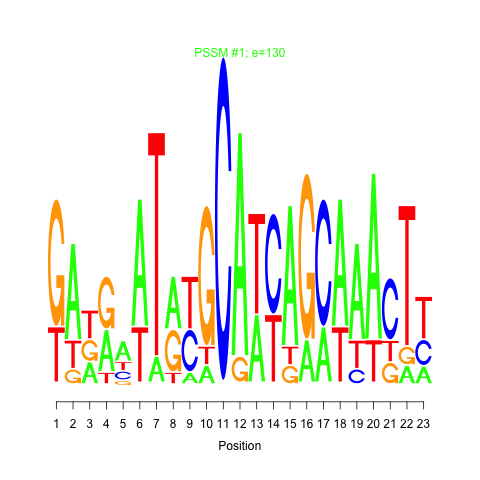
e.value:
130
Motif Bicluster:
Width:
23
Number of Sites:
1
Consensus:
GAtgaATatGCAtcAGCAAAcTt
| Title | Model version | Residual | Score |
|---|---|---|---|
| bicluster_0035 | v02 | 0.10 | -13.22 |
|
Differential Expression Time:
4 hour 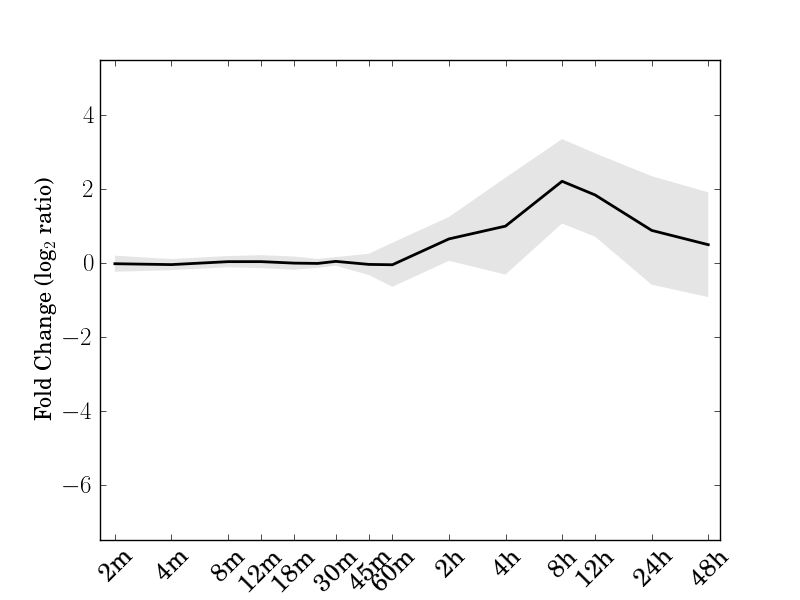 |
| Cre01.g009200.t1.2 BTB/POZ/MATH-domains containing protein | Cre01.g052750.t1.1 |
| Cre02.g077250.t1.1 | Cre02.g112550.t1.2 non-intrinsic ABC protein 12 |
| Cre03.g202250.t1.2 DNA-directed DNA polymerases | Cre06.g258650.t1.2 Phosphoglycerate mutase family protein |
| Cre06.g278250.t2.1 | Cre06.g307250.t1.2 |
| Cre08.g364600.t1.2 | Cre09.g397660.t1.1 |
| Cre10.g421350.t1.2 | Cre12.g536650.t1.2 |
| Cre12.g550702.t1.1 photosystem I P subunit | Cre12.g554550.t1.2 |
| Cre14.g608275.t1.1 | Cre14.g615350.t1.2 Truncated hemoglobin |
| Cre16.g668850.t1.1 Hydroxyproline-rich glycoprotein | Cre16.g681350.t1.1 |
| Cre16.g692902.t1.1 | Cre17.g696500.t1.1 Cell wall protein pherophorin-C19 |
| Cre17.g705300.t2.1 |
motif_0035_1Submitted by Anonymous (not verified) on Wed, 05/20/2015 - 14:16e.value: 130 Motif Bicluster: Width: 23 Number of Sites: 1 Consensus: GAtgaATatGCAtcAGCAAAcTt |
motif_0035_2Submitted by Anonymous (not verified) on Wed, 05/20/2015 - 14:16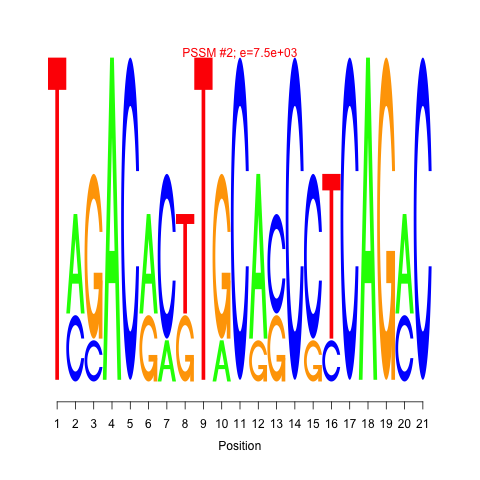 e.value: 7500 Motif Bicluster: Width: 21 Number of Sites: 1 Consensus: TaGACaCtTGCAcCCTCAGaC |
| Interaction | Weight | |
|---|---|---|
| up-regulates |
Cre03.g149350.t1.1Submitted by admin on Tue, 05/19/2015 - 15:51RWP-RK domain-containing protein |
0.068978 |
| down-regulates |
Cre09.g386753.t1.1Submitted by admin on Tue, 05/19/2015 - 15:51 |
0.071189 |
| up-regulates |
Cre12.g523000.t1.1Submitted by admin on Tue, 05/19/2015 - 15:51zinc finger protein 1 |
0.053837 |
| up-regulates |
Cre08.g375400.t1.1Submitted by admin on Tue, 05/19/2015 - 15:51KNOTTED-like homeobox of Arabidopsis thaliana 7 |
0.055032 |
| GO Terms | Descriptions |
|---|---|
| Not available |
Comments