Hierarchical Clusters
Displaying 4401 - 4500 of 7500
| Title | Cluster Plot | Dendrogram | e-value | e-value | e-value | Condition | Condition FDR | Condition Difference |
|---|---|---|---|---|---|---|---|---|
| Thaps_hclust_0207 |
 |
 |
0.0000000025 |
0.0000000037 |
0.1 |
highpH_TMEVA | 0.794000 | 0.0469 |
| Thaps_hclust_0207 |
|
|
0.0000000025 |
0.0000000037 |
0.1 |
co2_elevated_expo_arrays | 0.969000 | -0.0236 |
| Thaps_hclust_0207 |
|
|
0.0000000025 |
0.0000000037 |
0.1 |
lowFe_TMEVA | 0.869000 | 0.0624 |
| Thaps_hclust_0207 |
|
|
0.0000000025 |
0.0000000037 |
0.1 |
exponential_vs_stationary_24light | 0.005390 | 0.673 |
| Thaps_hclust_0207 |
|
|
0.0000000025 |
0.0000000037 |
0.1 |
lowN_TMEVA | 0.003130 | -0.758 |
| Thaps_hclust_0207 |
|
|
0.0000000025 |
0.0000000037 |
0.1 |
diel_exponential_vs_stationary | 0.092100 | 0.243 |
| Thaps_hclust_0207 |
|
|
0.0000000025 |
0.0000000037 |
0.1 |
lowSi_TMEVA | 0.655000 | -0.3 |
| Thaps_hclust_0207 |
|
|
0.0000000025 |
0.0000000037 |
0.1 |
highlight_arrays | 0.095200 | -0.221 |
| Thaps_hclust_0207 |
|
|
0.0000000025 |
0.0000000037 |
0.1 |
diel_light_vs_dark | 0.000485 | 0.569 |
| Thaps_hclust_0207 |
|
|
0.0000000025 |
0.0000000037 |
0.1 |
lowFe_KTKB_Day3 | 0.802000 | 0.0585 |
| Title | Cluster Plot | Dendrogram | e-value | e-value | e-value | Condition | Condition FDR | Condition Difference |
|---|---|---|---|---|---|---|---|---|
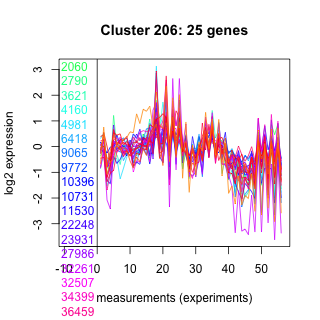
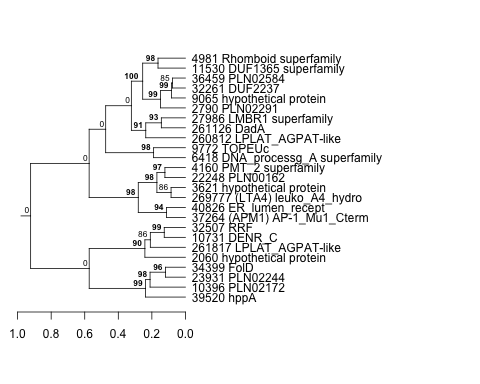
| Thaps_hclust_0206 |
 |
 |
0.00000000000075 |
0.0000028 |
3.5 |
lowFe_KTKB_Day5 | 0.090100 | 0.295 |
| Thaps_hclust_0206 |
|
|
0.00000000000075 |
0.0000028 |
3.5 |
BaP | 0.000370 | 0.811 |
| Thaps_hclust_0206 |
|
|
0.00000000000075 |
0.0000028 |
3.5 |
exponential_vs_stationary_24highlight | 0.000526 | 0.494 |
| Thaps_hclust_0206 |
|
|
0.00000000000075 |
0.0000028 |
3.5 |
co2_elevated_stat_arrays | 0.353000 | -0.207 |
| Thaps_hclust_0206 |
|
|
0.00000000000075 |
0.0000028 |
3.5 |
lowtemp_TMEVA | 0.909000 | 0.0348 |
| Thaps_hclust_0206 |
|
|
0.00000000000075 |
0.0000028 |
3.5 |
highpH_TMEVA | 0.242000 | -0.17 |
| Thaps_hclust_0206 |
|
|
0.00000000000075 |
0.0000028 |
3.5 |
co2_elevated_expo_arrays | 0.969000 | 0.0243 |
| Thaps_hclust_0206 |
|
|
0.00000000000075 |
0.0000028 |
3.5 |
lowFe_TMEVA | 0.853000 | 0.0703 |
| Thaps_hclust_0206 |
|
|
0.00000000000075 |
0.0000028 |
3.5 |
exponential_vs_stationary_24light | 0.000581 | 1.28 |
| Thaps_hclust_0206 |
|
|
0.00000000000075 |
0.0000028 |
3.5 |
lowN_TMEVA | 0.001190 | -0.92 |
| Thaps_hclust_0206 |
|
|
0.00000000000075 |
0.0000028 |
3.5 |
diel_exponential_vs_stationary | 0.002080 | 0.474 |
| Thaps_hclust_0206 |
|
|
0.00000000000075 |
0.0000028 |
3.5 |
lowSi_TMEVA | 0.022400 | -0.766 |
| Thaps_hclust_0206 |
|
|
0.00000000000075 |
0.0000028 |
3.5 |
highlight_arrays | 0.000442 | -0.568 |
| Thaps_hclust_0206 |
|
|
0.00000000000075 |
0.0000028 |
3.5 |
diel_light_vs_dark | 0.000485 | 0.717 |
| Thaps_hclust_0206 |
|
|
0.00000000000075 |
0.0000028 |
3.5 |
lowFe_KTKB_Day3 | 0.172000 | 0.28 |
| Title | Cluster Plot | Dendrogram | e-value | e-value | e-value | Condition | Condition FDR | Condition Difference |
|---|---|---|---|---|---|---|---|---|
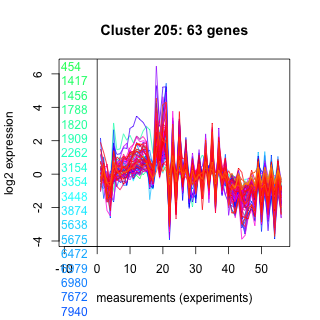
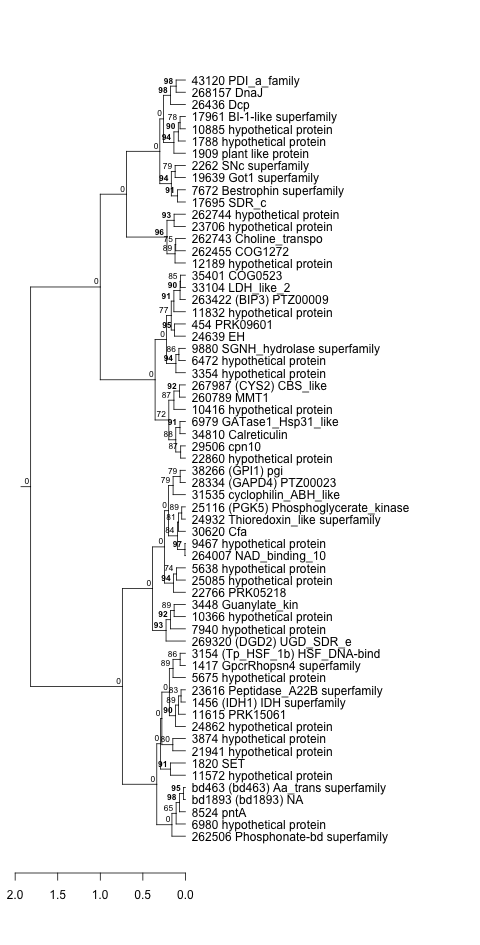
| Thaps_hclust_0205 |
 |
 |
2.3e-23 |
7.6e-16 |
0.00000015 |
lowFe_KTKB_Day3 | 0.453000 | 0.11 |
| Thaps_hclust_0205 |
|
|
2.3e-23 |
7.6e-16 |
0.00000015 |
lowFe_KTKB_Day5 | 0.978000 | 0.00427 |
| Thaps_hclust_0205 |
|
|
2.3e-23 |
7.6e-16 |
0.00000015 |
BaP | 0.000370 | 1.87 |
| Thaps_hclust_0205 |
|
|
2.3e-23 |
7.6e-16 |
0.00000015 |
exponential_vs_stationary_24highlight | 0.000526 | 0.396 |
| Thaps_hclust_0205 |
|
|
2.3e-23 |
7.6e-16 |
0.00000015 |
co2_elevated_stat_arrays | 0.778000 | -0.0836 |
| Thaps_hclust_0205 |
|
|
2.3e-23 |
7.6e-16 |
0.00000015 |
lowtemp_TMEVA | 0.012000 | 0.371 |
| Thaps_hclust_0205 |
|
|
2.3e-23 |
7.6e-16 |
0.00000015 |
highpH_TMEVA | 0.300000 | 0.11 |
| Thaps_hclust_0205 |
|
|
2.3e-23 |
7.6e-16 |
0.00000015 |
co2_elevated_expo_arrays | 0.282000 | 0.129 |
| Thaps_hclust_0205 |
|
|
2.3e-23 |
7.6e-16 |
0.00000015 |
lowFe_TMEVA | 0.810000 | 0.0887 |
| Thaps_hclust_0205 |
|
|
2.3e-23 |
7.6e-16 |
0.00000015 |
exponential_vs_stationary_24light | 0.000581 | 1.39 |
| Thaps_hclust_0205 |
|
|
2.3e-23 |
7.6e-16 |
0.00000015 |
lowN_TMEVA | 0.001190 | -0.696 |
| Thaps_hclust_0205 |
|
|
2.3e-23 |
7.6e-16 |
0.00000015 |
diel_exponential_vs_stationary | 0.914000 | 0.0153 |
| Thaps_hclust_0205 |
|
|
2.3e-23 |
7.6e-16 |
0.00000015 |
lowSi_TMEVA | 0.001350 | -0.925 |
| Thaps_hclust_0205 |
|
|
2.3e-23 |
7.6e-16 |
0.00000015 |
highlight_arrays | 0.000442 | -0.427 |
| Thaps_hclust_0205 |
|
|
2.3e-23 |
7.6e-16 |
0.00000015 |
diel_light_vs_dark | 0.000485 | 1.62 |
| Title | Cluster Plot | Dendrogram | e-value | e-value | e-value | Condition | Condition FDR | Condition Difference |
|---|---|---|---|---|---|---|---|---|
| Thaps_hclust_0204 |
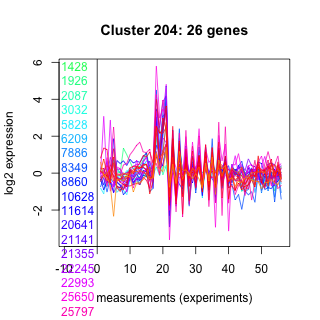 |
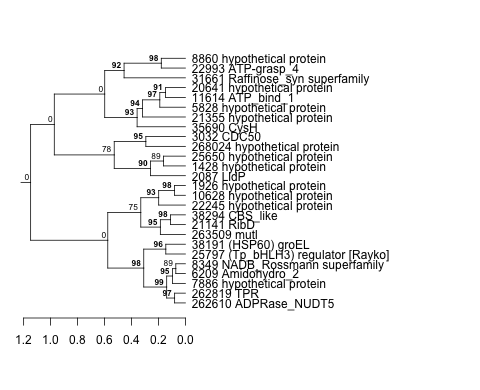 |
0.000065 |
0.008 |
0.00052 |
diel_light_vs_dark | 0.000485 | 1.38 |
| Thaps_hclust_0204 |
|
|
0.000065 |
0.008 |
0.00052 |
lowFe_KTKB_Day3 | 0.834000 | -0.054 |
| Thaps_hclust_0204 |
|
|
0.000065 |
0.008 |
0.00052 |
lowFe_KTKB_Day5 | 0.849000 | -0.038 |
| Thaps_hclust_0204 |
|
|
0.000065 |
0.008 |
0.00052 |
BaP | 0.000370 | 2.02 |
| Thaps_hclust_0204 |
|
|
0.000065 |
0.008 |
0.00052 |
exponential_vs_stationary_24highlight | 0.605000 | 0.0539 |
| Thaps_hclust_0204 |
|
|
0.000065 |
0.008 |
0.00052 |
co2_elevated_stat_arrays | 0.999000 | -0.00098 |
| Thaps_hclust_0204 |
|
|
0.000065 |
0.008 |
0.00052 |
lowtemp_TMEVA | 0.929000 | 0.0262 |
| Thaps_hclust_0204 |
|
|
0.000065 |
0.008 |
0.00052 |
highpH_TMEVA | 0.592000 | -0.0879 |
| Thaps_hclust_0204 |
|
|
0.000065 |
0.008 |
0.00052 |
co2_elevated_expo_arrays | 0.998000 | -0.00467 |
| Thaps_hclust_0204 |
|
|
0.000065 |
0.008 |
0.00052 |
lowFe_TMEVA | 0.856000 | 0.068 |
| Thaps_hclust_0204 |
|
|
0.000065 |
0.008 |
0.00052 |
exponential_vs_stationary_24light | 0.735000 | 0.123 |
| Thaps_hclust_0204 |
|
|
0.000065 |
0.008 |
0.00052 |
lowN_TMEVA | 0.818000 | -0.088 |
| Thaps_hclust_0204 |
|
|
0.000065 |
0.008 |
0.00052 |
diel_exponential_vs_stationary | 0.025200 | -0.333 |
| Thaps_hclust_0204 |
|
|
0.000065 |
0.008 |
0.00052 |
lowSi_TMEVA | 1.000000 | -0.0335 |
| Thaps_hclust_0204 |
|
|
0.000065 |
0.008 |
0.00052 |
highlight_arrays | 0.597000 | -0.082 |
| Title | Cluster Plot | Dendrogram | e-value | e-value | e-value | Condition | Condition FDR | Condition Difference |
|---|---|---|---|---|---|---|---|---|
| Thaps_hclust_0203 |
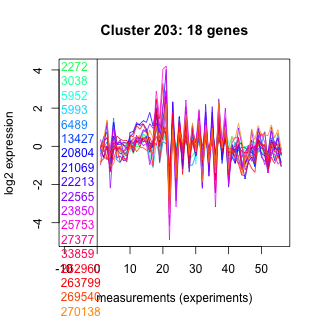 |
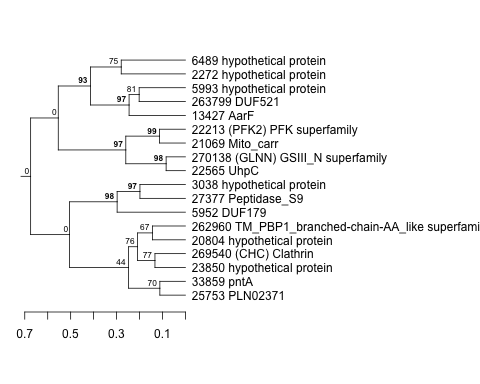 |
0.00051 |
1.2 |
1.3 |
diel_light_vs_dark | 0.000485 | 1.9 |
| Thaps_hclust_0203 |
|
|
0.00051 |
1.2 |
1.3 |
lowFe_KTKB_Day3 | 0.779000 | 0.087 |
| Thaps_hclust_0203 |
|
|
0.00051 |
1.2 |
1.3 |
lowFe_KTKB_Day5 | 0.915000 | 0.0267 |
| Thaps_hclust_0203 |
|
|
0.00051 |
1.2 |
1.3 |
BaP | 0.000370 | 1.1 |
| Thaps_hclust_0203 |
|
|
0.00051 |
1.2 |
1.3 |
exponential_vs_stationary_24highlight | 0.056600 | 0.211 |
| Thaps_hclust_0203 |
|
|
0.00051 |
1.2 |
1.3 |
co2_elevated_stat_arrays | 0.102000 | -0.376 |
| Thaps_hclust_0203 |
|
|
0.00051 |
1.2 |
1.3 |
lowtemp_TMEVA | 0.297000 | 0.284 |
| Thaps_hclust_0203 |
|
|
0.00051 |
1.2 |
1.3 |
highpH_TMEVA | 0.079600 | -0.292 |
| Thaps_hclust_0203 |
|
|
0.00051 |
1.2 |
1.3 |
co2_elevated_expo_arrays | 0.985000 | 0.00936 |
| Thaps_hclust_0203 |
|
|
0.00051 |
1.2 |
1.3 |
lowFe_TMEVA | 0.934000 | -0.0379 |
| Thaps_hclust_0203 |
|
|
0.00051 |
1.2 |
1.3 |
exponential_vs_stationary_24light | 0.230000 | 0.396 |
| Thaps_hclust_0203 |
|
|
0.00051 |
1.2 |
1.3 |
lowN_TMEVA | 0.481000 | 0.258 |
| Thaps_hclust_0203 |
|
|
0.00051 |
1.2 |
1.3 |
diel_exponential_vs_stationary | 0.001110 | -0.644 |
| Thaps_hclust_0203 |
|
|
0.00051 |
1.2 |
1.3 |
lowSi_TMEVA | 0.046800 | -0.839 |
| Thaps_hclust_0203 |
|
|
0.00051 |
1.2 |
1.3 |
highlight_arrays | 0.262000 | -0.195 |
| Title | Cluster Plot | Dendrogram | e-value | e-value | e-value | Condition | Condition FDR | Condition Difference |
|---|---|---|---|---|---|---|---|---|
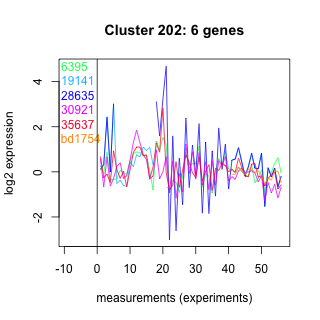
| Thaps_hclust_0202 |
 |
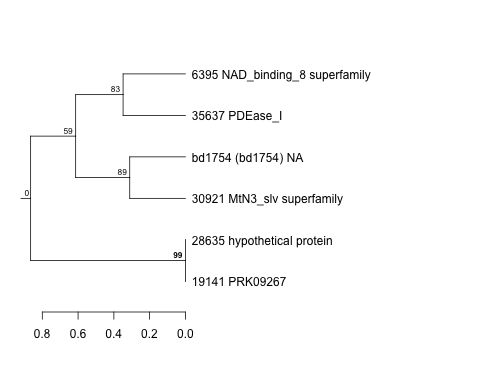 |
0.0064 |
0.023 |
0.32 |
highlight_arrays | 0.128000 | 0.436 |
| Thaps_hclust_0202 |
|
|
0.0064 |
0.023 |
0.32 |
diel_light_vs_dark | 0.005160 | 1.06 |
| Thaps_hclust_0202 |
|
|
0.0064 |
0.023 |
0.32 |
lowFe_KTKB_Day3 | 0.795000 | 0.127 |
| Thaps_hclust_0202 |
|
|
0.0064 |
0.023 |
0.32 |
lowFe_KTKB_Day5 | 0.766000 | -0.115 |
| Thaps_hclust_0202 |
|
|
0.0064 |
0.023 |
0.32 |
BaP | 0.000370 | 1.5 |
| Thaps_hclust_0202 |
|
|
0.0064 |
0.023 |
0.32 |
exponential_vs_stationary_24highlight | 0.460000 | 0.147 |
| Thaps_hclust_0202 |
|
|
0.0064 |
0.023 |
0.32 |
co2_elevated_stat_arrays | 0.697000 | -0.151 |
| Thaps_hclust_0202 |
|
|
0.0064 |
0.023 |
0.32 |
lowtemp_TMEVA | 0.017400 | 1.27 |
| Thaps_hclust_0202 |
|
|
0.0064 |
0.023 |
0.32 |
highpH_TMEVA | 0.194000 | 0.348 |
| Thaps_hclust_0202 |
|
|
0.0064 |
0.023 |
0.32 |
co2_elevated_expo_arrays | 0.968000 | -0.0342 |
| Thaps_hclust_0202 |
|
|
0.0064 |
0.023 |
0.32 |
lowFe_TMEVA | 0.888000 | -0.0684 |
| Thaps_hclust_0202 |
|
|
0.0064 |
0.023 |
0.32 |
exponential_vs_stationary_24light | 0.454000 | -0.424 |
| Thaps_hclust_0202 |
|
|
0.0064 |
0.023 |
0.32 |
lowN_TMEVA | 0.033300 | 1.26 |
| Thaps_hclust_0202 |
|
|
0.0064 |
0.023 |
0.32 |
diel_exponential_vs_stationary | 0.007320 | -0.953 |
| Thaps_hclust_0202 |
|
|
0.0064 |
0.023 |
0.32 |
lowSi_TMEVA | 0.806000 | -0.291 |
| Title | Cluster Plot | Dendrogram | e-value | e-value | e-value | Condition | Condition FDR | Condition Difference |
|---|---|---|---|---|---|---|---|---|
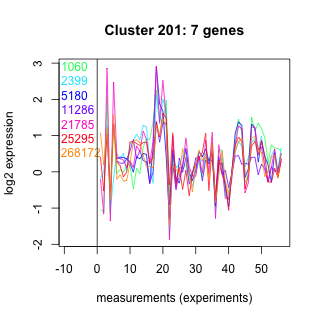
| Thaps_hclust_0201 |
 |
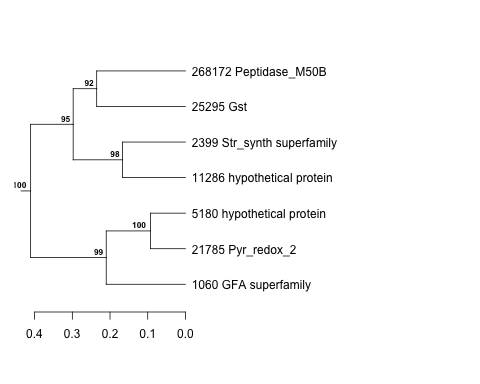 |
0.11 |
7.6 |
12 |
lowSi_TMEVA | 0.129000 | -0.977 |
| Thaps_hclust_0201 |
|
|
0.11 |
7.6 |
12 |
highlight_arrays | 0.416000 | 0.219 |
| Thaps_hclust_0201 |
|
|
0.11 |
7.6 |
12 |
diel_light_vs_dark | 0.114000 | 0.539 |
| Thaps_hclust_0201 |
|
|
0.11 |
7.6 |
12 |
lowFe_KTKB_Day3 | 0.742000 | 0.155 |
| Thaps_hclust_0201 |
|
|
0.11 |
7.6 |
12 |
lowFe_KTKB_Day5 | 0.200000 | 0.441 |
| Thaps_hclust_0201 |
|
|
0.11 |
7.6 |
12 |
BaP | 0.000370 | 1.6 |
| Thaps_hclust_0201 |
|
|
0.11 |
7.6 |
12 |
exponential_vs_stationary_24highlight | 0.300000 | -0.185 |
| Thaps_hclust_0201 |
|
|
0.11 |
7.6 |
12 |
co2_elevated_stat_arrays | 0.816000 | 0.0858 |
| Thaps_hclust_0201 |
|
|
0.11 |
7.6 |
12 |
lowtemp_TMEVA | 0.013200 | 1.31 |
| Thaps_hclust_0201 |
|
|
0.11 |
7.6 |
12 |
highpH_TMEVA | 0.965000 | 0.019 |
| Thaps_hclust_0201 |
|
|
0.11 |
7.6 |
12 |
co2_elevated_expo_arrays | 0.040600 | 0.449 |
| Thaps_hclust_0201 |
|
|
0.11 |
7.6 |
12 |
lowFe_TMEVA | 0.223000 | -0.525 |
| Thaps_hclust_0201 |
|
|
0.11 |
7.6 |
12 |
exponential_vs_stationary_24light | 0.820000 | -0.139 |
| Thaps_hclust_0201 |
|
|
0.11 |
7.6 |
12 |
lowN_TMEVA | 0.002270 | 1.69 |
| Thaps_hclust_0201 |
|
|
0.11 |
7.6 |
12 |
diel_exponential_vs_stationary | 0.949000 | -0.0259 |