Hierarchical Clusters
Displaying 5201 - 5300 of 7500
| Title | Cluster Plot | Dendrogram | e-value | e-value | e-value | Condition | Condition FDR | Condition Difference |
|---|---|---|---|---|---|---|---|---|
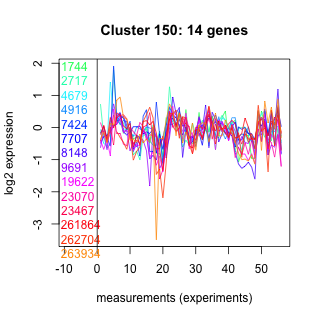
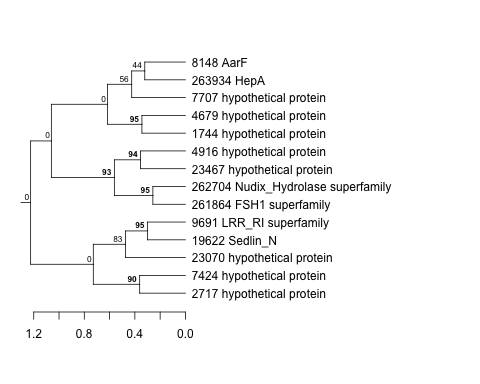
| Thaps_hclust_0154 |
 |
 |
0.00015 |
0.0049 |
0.29 |
exponential_vs_stationary_24highlight | 0.013600 | 0.241 |
| Thaps_hclust_0154 |
|
|
0.00015 |
0.0049 |
0.29 |
co2_elevated_stat_arrays | 0.004460 | -0.539 |
| Thaps_hclust_0154 |
|
|
0.00015 |
0.0049 |
0.29 |
lowtemp_TMEVA | 0.203000 | -0.322 |
| Thaps_hclust_0154 |
|
|
0.00015 |
0.0049 |
0.29 |
highpH_TMEVA | 0.092900 | -0.264 |
| Thaps_hclust_0154 |
|
|
0.00015 |
0.0049 |
0.29 |
co2_elevated_expo_arrays | 0.911000 | 0.0508 |
| Title | Cluster Plot | Dendrogram | e-value | e-value | e-value | Condition | Condition FDR | Condition Difference |
|---|---|---|---|---|---|---|---|---|
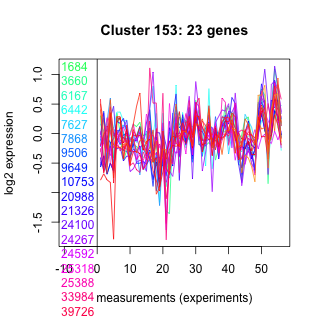
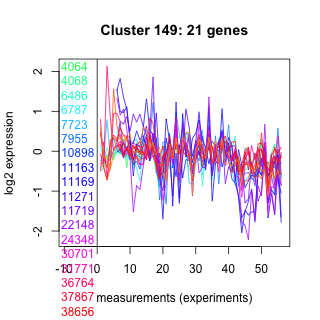
| Thaps_hclust_0153 |
 |
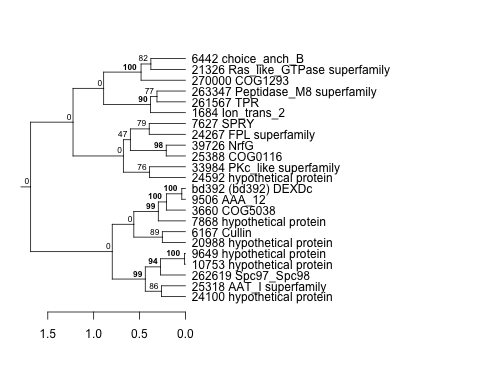 |
0.0000021 |
0.0049 |
0.015 |
co2_elevated_expo_arrays | 0.934000 | -0.0433 |
| Thaps_hclust_0153 |
|
|
0.0000021 |
0.0049 |
0.015 |
lowFe_TMEVA | 0.445000 | -0.206 |
| Thaps_hclust_0153 |
|
|
0.0000021 |
0.0049 |
0.015 |
exponential_vs_stationary_24light | 0.860000 | 0.0725 |
| Thaps_hclust_0153 |
|
|
0.0000021 |
0.0049 |
0.015 |
lowN_TMEVA | 0.400000 | -0.278 |
| Thaps_hclust_0153 |
|
|
0.0000021 |
0.0049 |
0.015 |
diel_exponential_vs_stationary | 0.382000 | -0.155 |
| Thaps_hclust_0153 |
|
|
0.0000021 |
0.0049 |
0.015 |
lowSi_TMEVA | 1.000000 | -0.01 |
| Thaps_hclust_0153 |
|
|
0.0000021 |
0.0049 |
0.015 |
highlight_arrays | 0.003500 | -0.409 |
| Thaps_hclust_0153 |
|
|
0.0000021 |
0.0049 |
0.015 |
diel_light_vs_dark | 0.566000 | -0.133 |
| Thaps_hclust_0153 |
|
|
0.0000021 |
0.0049 |
0.015 |
lowFe_KTKB_Day3 | 0.974000 | -0.0105 |
| Thaps_hclust_0153 |
|
|
0.0000021 |
0.0049 |
0.015 |
lowFe_KTKB_Day5 | 0.234000 | -0.227 |
| Thaps_hclust_0153 |
|
|
0.0000021 |
0.0049 |
0.015 |
BaP | 0.019000 | -0.467 |
| Thaps_hclust_0153 |
|
|
0.0000021 |
0.0049 |
0.015 |
exponential_vs_stationary_24highlight | 0.498000 | 0.0726 |
| Thaps_hclust_0153 |
|
|
0.0000021 |
0.0049 |
0.015 |
co2_elevated_stat_arrays | 0.017700 | -0.461 |
| Thaps_hclust_0153 |
|
|
0.0000021 |
0.0049 |
0.015 |
lowtemp_TMEVA | 0.102000 | -0.384 |
| Thaps_hclust_0153 |
|
|
0.0000021 |
0.0049 |
0.015 |
highpH_TMEVA | 0.396000 | -0.133 |
| Title | Cluster Plot | Dendrogram | e-value | e-value | e-value | Condition | Condition FDR | Condition Difference |
|---|---|---|---|---|---|---|---|---|
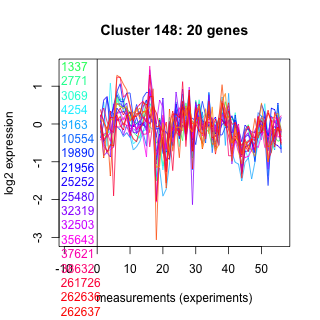
| Thaps_hclust_0152 |
 |
 |
0.00015 |
0.00023 |
0.031 |
highpH_TMEVA | 0.997000 | -0.00452 |
| Thaps_hclust_0152 |
|
|
0.00015 |
0.00023 |
0.031 |
co2_elevated_expo_arrays | 0.399000 | -0.211 |
| Thaps_hclust_0152 |
|
|
0.00015 |
0.00023 |
0.031 |
lowFe_TMEVA | 0.047400 | -0.755 |
| Thaps_hclust_0152 |
|
|
0.00015 |
0.00023 |
0.031 |
exponential_vs_stationary_24light | 0.348000 | -0.426 |
| Thaps_hclust_0152 |
|
|
0.00015 |
0.00023 |
0.031 |
lowN_TMEVA | 0.199000 | -0.585 |
| Thaps_hclust_0152 |
|
|
0.00015 |
0.00023 |
0.031 |
diel_exponential_vs_stationary | 0.779000 | 0.0888 |
| Thaps_hclust_0152 |
|
|
0.00015 |
0.00023 |
0.031 |
lowSi_TMEVA | 0.368000 | -0.589 |
| Thaps_hclust_0152 |
|
|
0.00015 |
0.00023 |
0.031 |
highlight_arrays | 0.000442 | -0.805 |
| Thaps_hclust_0152 |
|
|
0.00015 |
0.00023 |
0.031 |
diel_light_vs_dark | 0.100000 | -0.5 |
| Thaps_hclust_0152 |
|
|
0.00015 |
0.00023 |
0.031 |
lowFe_KTKB_Day3 | 0.006850 | -0.979 |
| Thaps_hclust_0152 |
|
|
0.00015 |
0.00023 |
0.031 |
lowFe_KTKB_Day5 | 0.001320 | -1.32 |
| Thaps_hclust_0152 |
|
|
0.00015 |
0.00023 |
0.031 |
BaP | 0.013800 | -0.816 |
| Thaps_hclust_0152 |
|
|
0.00015 |
0.00023 |
0.031 |
exponential_vs_stationary_24highlight | 0.040300 | -0.318 |
| Thaps_hclust_0152 |
|
|
0.00015 |
0.00023 |
0.031 |
co2_elevated_stat_arrays | 0.801000 | -0.0855 |
| Thaps_hclust_0152 |
|
|
0.00015 |
0.00023 |
0.031 |
lowtemp_TMEVA | 0.017400 | -0.993 |
| Title | Cluster Plot | Dendrogram | e-value | e-value | e-value | Condition | Condition FDR | Condition Difference |
|---|---|---|---|---|---|---|---|---|
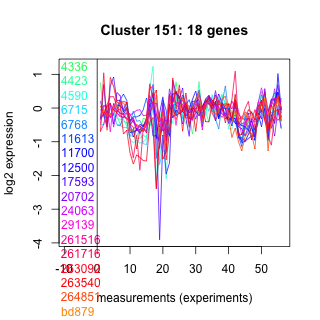
| Thaps_hclust_0151 |
 |
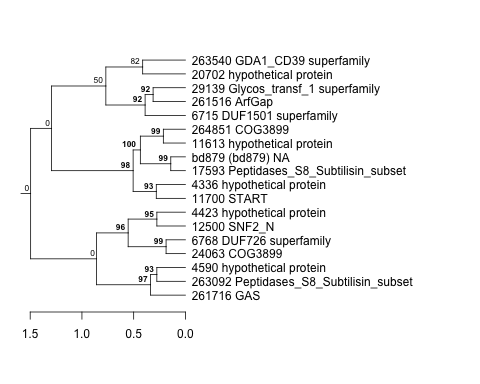 |
0.015 |
0.13 |
16 |
co2_elevated_expo_arrays | 0.677000 | 0.108 |
| Thaps_hclust_0151 |
|
|
0.015 |
0.13 |
16 |
lowFe_TMEVA | 0.977000 | -0.0171 |
| Thaps_hclust_0151 |
|
|
0.015 |
0.13 |
16 |
exponential_vs_stationary_24light | 0.547000 | 0.221 |
| Thaps_hclust_0151 |
|
|
0.015 |
0.13 |
16 |
lowN_TMEVA | 0.695000 | -0.156 |
| Thaps_hclust_0151 |
|
|
0.015 |
0.13 |
16 |
diel_exponential_vs_stationary | 0.807000 | 0.0568 |
| Thaps_hclust_0151 |
|
|
0.015 |
0.13 |
16 |
lowSi_TMEVA | 1.000000 | 0.0401 |
| Thaps_hclust_0151 |
|
|
0.015 |
0.13 |
16 |
highlight_arrays | 0.014600 | -0.388 |
| Thaps_hclust_0151 |
|
|
0.015 |
0.13 |
16 |
diel_light_vs_dark | 0.694000 | 0.111 |
| Thaps_hclust_0151 |
|
|
0.015 |
0.13 |
16 |
lowFe_KTKB_Day3 | 0.975000 | 0.00967 |
| Thaps_hclust_0151 |
|
|
0.015 |
0.13 |
16 |
lowFe_KTKB_Day5 | 0.519000 | 0.145 |
| Thaps_hclust_0151 |
|
|
0.015 |
0.13 |
16 |
BaP | 0.000709 | -0.774 |
| Thaps_hclust_0151 |
|
|
0.015 |
0.13 |
16 |
exponential_vs_stationary_24highlight | 0.801000 | -0.0336 |
| Thaps_hclust_0151 |
|
|
0.015 |
0.13 |
16 |
co2_elevated_stat_arrays | 0.063900 | -0.422 |
| Thaps_hclust_0151 |
|
|
0.015 |
0.13 |
16 |
lowtemp_TMEVA | 0.902000 | 0.041 |
| Thaps_hclust_0151 |
|
|
0.015 |
0.13 |
16 |
highpH_TMEVA | 0.202000 | -0.213 |
| Title | Cluster Plot | Dendrogram | e-value | e-value | e-value | Condition | Condition FDR | Condition Difference |
|---|---|---|---|---|---|---|---|---|
| Thaps_hclust_0150 |
 |
 |
0.16 |
0.73 |
6.8 |
highpH_TMEVA | 0.306000 | -0.191 |
| Thaps_hclust_0150 |
|
|
0.16 |
0.73 |
6.8 |
co2_elevated_expo_arrays | 0.873000 | -0.0687 |
| Thaps_hclust_0150 |
|
|
0.16 |
0.73 |
6.8 |
lowFe_TMEVA | 0.552000 | -0.2 |
| Thaps_hclust_0150 |
|
|
0.16 |
0.73 |
6.8 |
exponential_vs_stationary_24light | 0.155000 | 0.517 |
| Thaps_hclust_0150 |
|
|
0.16 |
0.73 |
6.8 |
lowN_TMEVA | 0.240000 | -0.461 |
| Thaps_hclust_0150 |
|
|
0.16 |
0.73 |
6.8 |
diel_exponential_vs_stationary | 0.366000 | 0.206 |
| Thaps_hclust_0150 |
|
|
0.16 |
0.73 |
6.8 |
lowSi_TMEVA | 1.000000 | -0.0264 |
| Thaps_hclust_0150 |
|
|
0.16 |
0.73 |
6.8 |
highlight_arrays | 0.047100 | -0.366 |
| Thaps_hclust_0150 |
|
|
0.16 |
0.73 |
6.8 |
diel_light_vs_dark | 0.656000 | 0.137 |
| Thaps_hclust_0150 |
|
|
0.16 |
0.73 |
6.8 |
lowFe_KTKB_Day3 | 0.154000 | -0.395 |
| Thaps_hclust_0150 |
|
|
0.16 |
0.73 |
6.8 |
lowFe_KTKB_Day5 | 0.337000 | -0.236 |
| Thaps_hclust_0150 |
|
|
0.16 |
0.73 |
6.8 |
BaP | 0.005830 | -0.677 |
| Thaps_hclust_0150 |
|
|
0.16 |
0.73 |
6.8 |
exponential_vs_stationary_24highlight | 0.102000 | 0.204 |
| Thaps_hclust_0150 |
|
|
0.16 |
0.73 |
6.8 |
co2_elevated_stat_arrays | 0.178000 | -0.339 |
| Thaps_hclust_0150 |
|
|
0.16 |
0.73 |
6.8 |
lowtemp_TMEVA | 0.078400 | 0.538 |
| Title | Cluster Plot | Dendrogram | e-value | e-value | e-value | Condition | Condition FDR | Condition Difference |
|---|---|---|---|---|---|---|---|---|
| Thaps_hclust_0149 |
 |
 |
0.00000027 |
0.46 |
3 |
lowtemp_TMEVA | 0.263000 | 0.285 |
| Thaps_hclust_0149 |
|
|
0.00000027 |
0.46 |
3 |
highpH_TMEVA | 0.835000 | 0.0417 |
| Thaps_hclust_0149 |
|
|
0.00000027 |
0.46 |
3 |
co2_elevated_expo_arrays | 0.926000 | 0.0473 |
| Thaps_hclust_0149 |
|
|
0.00000027 |
0.46 |
3 |
lowFe_TMEVA | 0.427000 | -0.222 |
| Thaps_hclust_0149 |
|
|
0.00000027 |
0.46 |
3 |
exponential_vs_stationary_24light | 0.406000 | 0.272 |
| Thaps_hclust_0149 |
|
|
0.00000027 |
0.46 |
3 |
lowN_TMEVA | 0.963000 | -0.0171 |
| Thaps_hclust_0149 |
|
|
0.00000027 |
0.46 |
3 |
diel_exponential_vs_stationary | 0.937000 | -0.0202 |
| Thaps_hclust_0149 |
|
|
0.00000027 |
0.46 |
3 |
lowSi_TMEVA | 1.000000 | -0.0367 |
| Thaps_hclust_0149 |
|
|
0.00000027 |
0.46 |
3 |
highlight_arrays | 0.780000 | -0.0526 |
| Thaps_hclust_0149 |
|
|
0.00000027 |
0.46 |
3 |
diel_light_vs_dark | 0.154000 | -0.286 |
| Thaps_hclust_0149 |
|
|
0.00000027 |
0.46 |
3 |
lowFe_KTKB_Day3 | 0.570000 | 0.153 |
| Thaps_hclust_0149 |
|
|
0.00000027 |
0.46 |
3 |
lowFe_KTKB_Day5 | 0.095200 | 0.328 |
| Thaps_hclust_0149 |
|
|
0.00000027 |
0.46 |
3 |
BaP | 0.112000 | -0.32 |
| Thaps_hclust_0149 |
|
|
0.00000027 |
0.46 |
3 |
exponential_vs_stationary_24highlight | 0.246000 | 0.122 |
| Thaps_hclust_0149 |
|
|
0.00000027 |
0.46 |
3 |
co2_elevated_stat_arrays | 0.069800 | -0.375 |
| Title | Cluster Plot | Dendrogram | e-value | e-value | e-value | Condition | Condition FDR | Condition Difference |
|---|---|---|---|---|---|---|---|---|
| Thaps_hclust_0148 |
 |
 |
4.7 |
39 |
51 |
co2_elevated_stat_arrays | 0.059800 | -0.409 |
| Thaps_hclust_0148 |
|
|
4.7 |
39 |
51 |
lowtemp_TMEVA | 0.640000 | -0.129 |
| Thaps_hclust_0148 |
|
|
4.7 |
39 |
51 |
highpH_TMEVA | 0.984000 | 0.00668 |
| Thaps_hclust_0148 |
|
|
4.7 |
39 |
51 |
co2_elevated_expo_arrays | 0.873000 | 0.0629 |
| Thaps_hclust_0148 |
|
|
4.7 |
39 |
51 |
lowFe_TMEVA | 0.549000 | -0.182 |
| Thaps_hclust_0148 |
|
|
4.7 |
39 |
51 |
exponential_vs_stationary_24light | 0.597000 | 0.194 |
| Thaps_hclust_0148 |
|
|
4.7 |
39 |
51 |
lowN_TMEVA | 0.505000 | -0.241 |
| Thaps_hclust_0148 |
|
|
4.7 |
39 |
51 |
diel_exponential_vs_stationary | 0.533000 | -0.126 |
| Thaps_hclust_0148 |
|
|
4.7 |
39 |
51 |
lowSi_TMEVA | 0.854000 | -0.205 |
| Thaps_hclust_0148 |
|
|
4.7 |
39 |
51 |
highlight_arrays | 0.047900 | -0.304 |
| Thaps_hclust_0148 |
|
|
4.7 |
39 |
51 |
diel_light_vs_dark | 0.307000 | -0.224 |
| Thaps_hclust_0148 |
|
|
4.7 |
39 |
51 |
lowFe_KTKB_Day3 | 0.023900 | 0.503 |
| Thaps_hclust_0148 |
|
|
4.7 |
39 |
51 |
lowFe_KTKB_Day5 | 0.068400 | 0.357 |
| Thaps_hclust_0148 |
|
|
4.7 |
39 |
51 |
BaP | 0.001620 | -0.654 |
| Thaps_hclust_0148 |
|
|
4.7 |
39 |
51 |
exponential_vs_stationary_24highlight | 0.452000 | 0.0871 |
| Title | Cluster Plot | Dendrogram | e-value | e-value | e-value | Condition | Condition FDR | Condition Difference |
|---|---|---|---|---|---|---|---|---|
| Thaps_hclust_0147 |
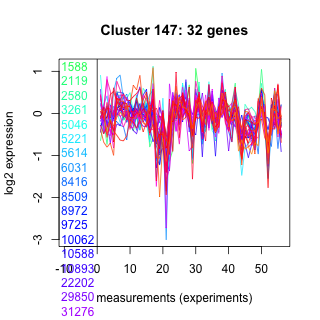 |
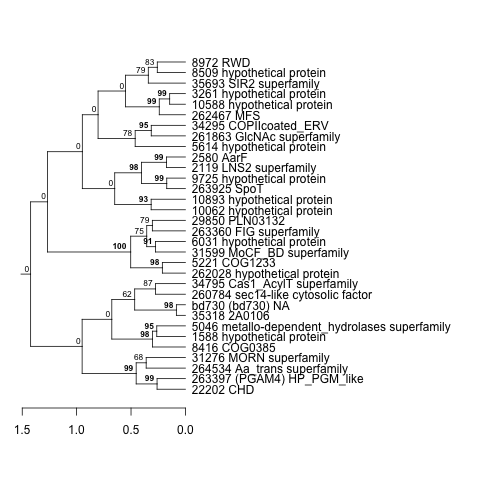 |
0.0000023 |
0.000053 |
1.9 |
exponential_vs_stationary_24highlight | 0.344000 | 0.0822 |
| Thaps_hclust_0147 |
|
|
0.0000023 |
0.000053 |
1.9 |
co2_elevated_stat_arrays | 0.000658 | -0.653 |
| Thaps_hclust_0147 |
|
|
0.0000023 |
0.000053 |
1.9 |
lowtemp_TMEVA | 0.407000 | -0.174 |
| Thaps_hclust_0147 |
|
|
0.0000023 |
0.000053 |
1.9 |
highpH_TMEVA | 0.964000 | 0.0118 |
| Thaps_hclust_0147 |
|
|
0.0000023 |
0.000053 |
1.9 |
co2_elevated_expo_arrays | 0.873000 | -0.0629 |