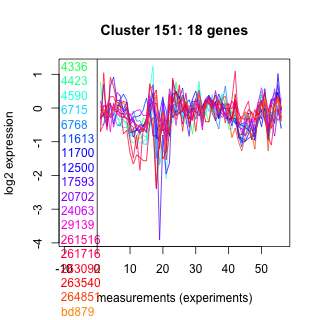
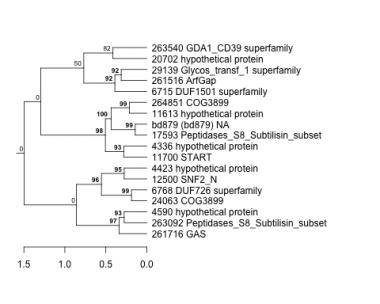
Thaps_hclust_0151 Hierarchical Clustering
Thalassiosira pseudonana
| GO ID | Go Term | p-value | q-value | Cluster |
|---|---|---|---|---|
| GO:0006508 | proteolysis and peptidolysis | 0.00190967 | 1 | Thaps_hclust_0151 |
| GO:0043087 | regulation of GTPase activity | 0.0102986 | 1 | Thaps_hclust_0151 |
| GO:0019538 | protein metabolism | 0.0466732 | 1 | Thaps_hclust_0151 |
|
4336 : hypothetical protein |
11613 : hypothetical protein |
24063 : COG3899 |
263092 : Peptidases_S8_Subtilisin_subset |
|
4423 : hypothetical protein |
11700 : START |
29139 : Glycos_transf_1 superfamily |
263540 : GDA1_CD39 superfamily |
|
4590 : hypothetical protein |
12500 : SNF2_N |
261516 : ArfGap |
264851 : COG3899 |
|
6715 : DUF1501 superfamily |
17593 : Peptidases_S8_Subtilisin_subset |
261716 : GAS |
bd879 : (bd879) NA |
|
6768 : DUF726 superfamily |
20702 : hypothetical protein |
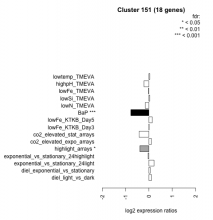
| Condition | Condition | Difference | FDR |
|---|---|---|---|
| diel_light_vs_dark | diel_light_vs_dark | 0.111 | 0.694 |
| lowFe_KTKB_Day3 | lowFe_KTKB_Day3 | 0.010 | 0.975 |
| lowFe_KTKB_Day5 | lowFe_KTKB_Day5 | 0.145 | 0.519 |
| BaP | BaP | -0.774 | 0.000709 |
| exponential_vs_stationary_24highlight | exponential_vs_stationary_24highlight | -0.034 | 0.801 |
| co2_elevated_stat_arrays | co2_elevated_stat_arrays | -0.422 | 0.0639 |
| lowtemp_TMEVA | lowtemp_TMEVA | 0.041 | 0.902 |
| highpH_TMEVA | highpH_TMEVA | -0.213 | 0.202 |
| co2_elevated_expo_arrays | co2_elevated_expo_arrays | 0.108 | 0.677 |
| lowFe_TMEVA | lowFe_TMEVA | -0.017 | 0.977 |
| exponential_vs_stationary_24light | exponential_vs_stationary_24light | 0.221 | 0.547 |
| lowN_TMEVA | lowN_TMEVA | -0.156 | 0.695 |
| diel_exponential_vs_stationary | diel_exponential_vs_stationary | 0.057 | 0.807 |
| lowSi_TMEVA | lowSi_TMEVA | 0.040 | 1 |
| highlight_arrays | highlight_arrays | -0.388 | 0.0146 |


