Hierarchical Clusters
Displaying 1 - 100 of 7500
| Title | Cluster Plot | Dendrogram | e-value | e-value | e-value | Condition | Condition FDR | Condition Difference |
|---|---|---|---|---|---|---|---|---|
| Thaps_hclust_0500 |
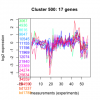 |
 |
0.91 |
14 |
30 |
diel_light_vs_dark | 0.108000 | -0.352 |
| Thaps_hclust_0500 |
 |
 |
0.91 |
14 |
30 |
lowFe_KTKB_Day3 | 0.000862 | -1.22 |
| Thaps_hclust_0500 |
 |
 |
0.91 |
14 |
30 |
lowFe_KTKB_Day5 | 0.012300 | -0.527 |
| Thaps_hclust_0500 |
 |
 |
0.91 |
14 |
30 |
BaP | 0.000370 | -1.23 |
| Thaps_hclust_0500 |
 |
 |
0.91 |
14 |
30 |
exponential_vs_stationary_24highlight | 0.390000 | -0.104 |
| Thaps_hclust_0500 |
 |
 |
0.91 |
14 |
30 |
co2_elevated_stat_arrays | 0.066100 | 0.423 |
| Thaps_hclust_0500 |
 |
 |
0.91 |
14 |
30 |
lowtemp_TMEVA | 0.966000 | -0.0151 |
| Thaps_hclust_0500 |
 |
 |
0.91 |
14 |
30 |
highpH_TMEVA | 0.851000 | -0.0416 |
| Thaps_hclust_0500 |
 |
 |
0.91 |
14 |
30 |
co2_elevated_expo_arrays | 0.767000 | 0.0916 |
| Thaps_hclust_0500 |
 |
 |
0.91 |
14 |
30 |
lowFe_TMEVA | 0.671000 | -0.148 |
| Thaps_hclust_0500 |
 |
 |
0.91 |
14 |
30 |
exponential_vs_stationary_24light | 0.499000 | -0.251 |
| Thaps_hclust_0500 |
 |
 |
0.91 |
14 |
30 |
lowN_TMEVA | 0.761000 | 0.123 |
| Thaps_hclust_0500 |
 |
 |
0.91 |
14 |
30 |
diel_exponential_vs_stationary | 0.533000 | -0.136 |
| Thaps_hclust_0500 |
 |
 |
0.91 |
14 |
30 |
lowSi_TMEVA | 0.832000 | 0.235 |
| Thaps_hclust_0500 |
 |
 |
0.91 |
14 |
30 |
highlight_arrays | 0.000442 | 1.08 |
| Title | Cluster Plot | Dendrogram | e-value | e-value | e-value | Condition | Condition FDR | Condition Difference |
|---|---|---|---|---|---|---|---|---|
| Thaps_hclust_0499 |
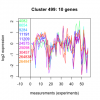 |
 |
0.13 |
5.4 |
18 |
highlight_arrays | 0.000442 | 0.993 |
| Thaps_hclust_0499 |
 |
 |
0.13 |
5.4 |
18 |
diel_light_vs_dark | 0.668000 | -0.156 |
| Thaps_hclust_0499 |
 |
 |
0.13 |
5.4 |
18 |
lowFe_KTKB_Day3 | 0.048400 | -0.655 |
| Thaps_hclust_0499 |
 |
 |
0.13 |
5.4 |
18 |
lowFe_KTKB_Day5 | 0.689000 | -0.12 |
| Thaps_hclust_0499 |
 |
 |
0.13 |
5.4 |
18 |
BaP | 0.001030 | -1.07 |
| Thaps_hclust_0499 |
 |
 |
0.13 |
5.4 |
18 |
exponential_vs_stationary_24highlight | 0.075700 | -0.267 |
| Thaps_hclust_0499 |
 |
 |
0.13 |
5.4 |
18 |
co2_elevated_stat_arrays | 0.000658 | 1.25 |
| Thaps_hclust_0499 |
 |
 |
0.13 |
5.4 |
18 |
lowtemp_TMEVA | 0.035900 | -0.791 |
| Thaps_hclust_0499 |
 |
 |
0.13 |
5.4 |
18 |
highpH_TMEVA | 0.145000 | -0.318 |
| Thaps_hclust_0499 |
 |
 |
0.13 |
5.4 |
18 |
co2_elevated_expo_arrays | 0.059000 | -0.366 |
| Thaps_hclust_0499 |
 |
 |
0.13 |
5.4 |
18 |
lowFe_TMEVA | 0.019500 | -0.853 |
| Thaps_hclust_0499 |
 |
 |
0.13 |
5.4 |
18 |
exponential_vs_stationary_24light | 0.728000 | -0.176 |
| Thaps_hclust_0499 |
 |
 |
0.13 |
5.4 |
18 |
lowN_TMEVA | 0.761000 | -0.141 |
| Thaps_hclust_0499 |
 |
 |
0.13 |
5.4 |
18 |
diel_exponential_vs_stationary | 0.555000 | -0.159 |
| Thaps_hclust_0499 |
 |
 |
0.13 |
5.4 |
18 |
lowSi_TMEVA | 0.298000 | -0.63 |
| Title | Cluster Plot | Dendrogram | e-value | e-value | e-value | Condition | Condition FDR | Condition Difference |
|---|---|---|---|---|---|---|---|---|
| Thaps_hclust_0498 |
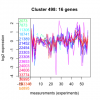 |
 |
1.3 |
1.8 |
1.8 |
lowSi_TMEVA | 0.010900 | -1.01 |
| Thaps_hclust_0498 |
 |
 |
1.3 |
1.8 |
1.8 |
highlight_arrays | 0.000442 | 0.73 |
| Thaps_hclust_0498 |
 |
 |
1.3 |
1.8 |
1.8 |
diel_light_vs_dark | 0.192000 | -0.299 |
| Thaps_hclust_0498 |
 |
 |
1.3 |
1.8 |
1.8 |
lowFe_KTKB_Day3 | 0.886000 | 0.0502 |
| Thaps_hclust_0498 |
 |
 |
1.3 |
1.8 |
1.8 |
lowFe_KTKB_Day5 | 0.767000 | -0.0759 |
| Thaps_hclust_0498 |
 |
 |
1.3 |
1.8 |
1.8 |
BaP | 0.006080 | -0.632 |
| Thaps_hclust_0498 |
 |
 |
1.3 |
1.8 |
1.8 |
exponential_vs_stationary_24highlight | 0.026000 | -0.253 |
| Thaps_hclust_0498 |
 |
 |
1.3 |
1.8 |
1.8 |
co2_elevated_stat_arrays | 0.033100 | 0.489 |
| Thaps_hclust_0498 |
 |
 |
1.3 |
1.8 |
1.8 |
lowtemp_TMEVA | 0.000735 | -1.08 |
| Thaps_hclust_0498 |
 |
 |
1.3 |
1.8 |
1.8 |
highpH_TMEVA | 0.000725 | 0.839 |
| Thaps_hclust_0498 |
 |
 |
1.3 |
1.8 |
1.8 |
co2_elevated_expo_arrays | 0.021800 | -0.33 |
| Thaps_hclust_0498 |
 |
 |
1.3 |
1.8 |
1.8 |
lowFe_TMEVA | 0.001040 | -1.01 |
| Thaps_hclust_0498 |
 |
 |
1.3 |
1.8 |
1.8 |
exponential_vs_stationary_24light | 0.117000 | -0.535 |
| Thaps_hclust_0498 |
 |
 |
1.3 |
1.8 |
1.8 |
lowN_TMEVA | 0.663000 | 0.179 |
| Thaps_hclust_0498 |
 |
 |
1.3 |
1.8 |
1.8 |
diel_exponential_vs_stationary | 0.156000 | -0.284 |
| Title | Cluster Plot | Dendrogram | e-value | e-value | e-value | Condition | Condition FDR | Condition Difference |
|---|---|---|---|---|---|---|---|---|
| Thaps_hclust_0497 |
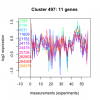 |
 |
0.1 |
5.2 |
29 |
diel_exponential_vs_stationary | 0.804000 | -0.072 |
| Thaps_hclust_0497 |
 |
 |
0.1 |
5.2 |
29 |
lowSi_TMEVA | 0.893000 | -0.186 |
| Thaps_hclust_0497 |
 |
 |
0.1 |
5.2 |
29 |
highlight_arrays | 0.018200 | 0.498 |
| Thaps_hclust_0497 |
 |
 |
0.1 |
5.2 |
29 |
diel_light_vs_dark | 0.626000 | -0.164 |
| Thaps_hclust_0497 |
 |
 |
0.1 |
5.2 |
29 |
lowFe_KTKB_Day3 | 0.744000 | 0.123 |
| Thaps_hclust_0497 |
 |
 |
0.1 |
5.2 |
29 |
lowFe_KTKB_Day5 | 0.802000 | 0.0754 |
| Thaps_hclust_0497 |
 |
 |
0.1 |
5.2 |
29 |
BaP | 0.259000 | -0.336 |
| Thaps_hclust_0497 |
 |
 |
0.1 |
5.2 |
29 |
exponential_vs_stationary_24highlight | 0.182000 | -0.193 |
| Thaps_hclust_0497 |
 |
 |
0.1 |
5.2 |
29 |
co2_elevated_stat_arrays | 0.630000 | 0.145 |
| Thaps_hclust_0497 |
 |
 |
0.1 |
5.2 |
29 |
lowtemp_TMEVA | 0.260000 | 0.388 |
| Thaps_hclust_0497 |
 |
 |
0.1 |
5.2 |
29 |
highpH_TMEVA | 0.003090 | 0.756 |
| Thaps_hclust_0497 |
 |
 |
0.1 |
5.2 |
29 |
co2_elevated_expo_arrays | 0.487000 | -0.166 |
| Thaps_hclust_0497 |
 |
 |
0.1 |
5.2 |
29 |
lowFe_TMEVA | 0.626000 | -0.18 |
| Thaps_hclust_0497 |
 |
 |
0.1 |
5.2 |
29 |
exponential_vs_stationary_24light | 0.314000 | -0.415 |
| Thaps_hclust_0497 |
 |
 |
0.1 |
5.2 |
29 |
lowN_TMEVA | 0.605000 | 0.223 |
| Title | Cluster Plot | Dendrogram | e-value | e-value | e-value | Condition | Condition FDR | Condition Difference |
|---|---|---|---|---|---|---|---|---|
| Thaps_hclust_0496 |
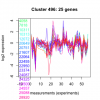 |
 |
0.00082 |
0.0031 |
0.43 |
diel_exponential_vs_stationary | 0.000602 | 0.802 |
| Thaps_hclust_0496 |
 |
 |
0.00082 |
0.0031 |
0.43 |
lowSi_TMEVA | 0.001350 | -1.29 |
| Thaps_hclust_0496 |
 |
 |
0.00082 |
0.0031 |
0.43 |
highlight_arrays | 0.000442 | 0.571 |
| Thaps_hclust_0496 |
 |
 |
0.00082 |
0.0031 |
0.43 |
diel_light_vs_dark | 0.009630 | -0.447 |
| Thaps_hclust_0496 |
 |
 |
0.00082 |
0.0031 |
0.43 |
lowFe_KTKB_Day3 | 0.000862 | -1.02 |
| Thaps_hclust_0496 |
 |
 |
0.00082 |
0.0031 |
0.43 |
lowFe_KTKB_Day5 | 0.004170 | -0.493 |
| Thaps_hclust_0496 |
 |
 |
0.00082 |
0.0031 |
0.43 |
BaP | 0.000370 | -1.29 |
| Thaps_hclust_0496 |
 |
 |
0.00082 |
0.0031 |
0.43 |
exponential_vs_stationary_24highlight | 0.043800 | -0.186 |
| Thaps_hclust_0496 |
 |
 |
0.00082 |
0.0031 |
0.43 |
co2_elevated_stat_arrays | 0.000658 | 1.13 |
| Thaps_hclust_0496 |
 |
 |
0.00082 |
0.0031 |
0.43 |
lowtemp_TMEVA | 0.000735 | -2.87 |
| Thaps_hclust_0496 |
 |
 |
0.00082 |
0.0031 |
0.43 |
highpH_TMEVA | 0.000725 | 0.468 |
| Thaps_hclust_0496 |
 |
 |
0.00082 |
0.0031 |
0.43 |
co2_elevated_expo_arrays | 0.001390 | -0.54 |
| Thaps_hclust_0496 |
 |
 |
0.00082 |
0.0031 |
0.43 |
lowFe_TMEVA | 0.001040 | -1.2 |
| Thaps_hclust_0496 |
 |
 |
0.00082 |
0.0031 |
0.43 |
exponential_vs_stationary_24light | 0.989000 | 0.00372 |
| Thaps_hclust_0496 |
 |
 |
0.00082 |
0.0031 |
0.43 |
lowN_TMEVA | 0.193000 | -0.395 |
| Title | Cluster Plot | Dendrogram | e-value | e-value | e-value | Condition | Condition FDR | Condition Difference |
|---|---|---|---|---|---|---|---|---|
| Thaps_hclust_0495 |
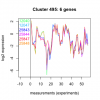 |
 |
0.0000000031 |
0.00000049 |
0.0000038 |
lowN_TMEVA | 0.008330 | -1.69 |
| Thaps_hclust_0495 |
 |
 |
0.0000000031 |
0.00000049 |
0.0000038 |
diel_exponential_vs_stationary | 0.000602 | 1.73 |
| Thaps_hclust_0495 |
 |
 |
0.0000000031 |
0.00000049 |
0.0000038 |
lowSi_TMEVA | 0.014200 | -1.75 |
| Thaps_hclust_0495 |
 |
 |
0.0000000031 |
0.00000049 |
0.0000038 |
highlight_arrays | 0.174000 | -0.385 |
| Thaps_hclust_0495 |
 |
 |
0.0000000031 |
0.00000049 |
0.0000038 |
diel_light_vs_dark | 0.102000 | -0.608 |
| Thaps_hclust_0495 |
 |
 |
0.0000000031 |
0.00000049 |
0.0000038 |
lowFe_KTKB_Day3 | 0.000862 | -4.91 |
| Thaps_hclust_0495 |
 |
 |
0.0000000031 |
0.00000049 |
0.0000038 |
lowFe_KTKB_Day5 | 0.001320 | -2.74 |
| Thaps_hclust_0495 |
 |
 |
0.0000000031 |
0.00000049 |
0.0000038 |
BaP | 0.000370 | -2.46 |
| Thaps_hclust_0495 |
 |
 |
0.0000000031 |
0.00000049 |
0.0000038 |
exponential_vs_stationary_24highlight | 0.034100 | 0.416 |
| Thaps_hclust_0495 |
 |
 |
0.0000000031 |
0.00000049 |
0.0000038 |
co2_elevated_stat_arrays | 0.954000 | 0.02 |
| Thaps_hclust_0495 |
 |
 |
0.0000000031 |
0.00000049 |
0.0000038 |
lowtemp_TMEVA | 0.000735 | -2.32 |
| Thaps_hclust_0495 |
 |
 |
0.0000000031 |
0.00000049 |
0.0000038 |
highpH_TMEVA | 0.000725 | 1.84 |
| Thaps_hclust_0495 |
 |
 |
0.0000000031 |
0.00000049 |
0.0000038 |
co2_elevated_expo_arrays | 0.001390 | -1.69 |
| Thaps_hclust_0495 |
 |
 |
0.0000000031 |
0.00000049 |
0.0000038 |
lowFe_TMEVA | 0.002000 | -1.62 |
| Thaps_hclust_0495 |
 |
 |
0.0000000031 |
0.00000049 |
0.0000038 |
exponential_vs_stationary_24light | 0.095000 | 0.895 |
| Title | Cluster Plot | Dendrogram | e-value | e-value | e-value | Condition | Condition FDR | Condition Difference |
|---|---|---|---|---|---|---|---|---|
| Thaps_hclust_0494 |
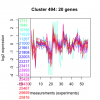 |
 |
6.7 |
15 |
60 |
exponential_vs_stationary_24light | 0.406000 | -0.278 |
| Thaps_hclust_0494 |
 |
 |
6.7 |
15 |
60 |
lowN_TMEVA | 0.842000 | 0.08 |
| Thaps_hclust_0494 |
 |
 |
6.7 |
15 |
60 |
diel_exponential_vs_stationary | 0.000602 | 1.04 |
| Thaps_hclust_0494 |
 |
 |
6.7 |
15 |
60 |
lowSi_TMEVA | 0.050000 | -0.762 |
| Thaps_hclust_0494 |
 |
 |
6.7 |
15 |
60 |
highlight_arrays | 0.001570 | 0.468 |
| Thaps_hclust_0494 |
 |
 |
6.7 |
15 |
60 |
diel_light_vs_dark | 0.000485 | -0.616 |
| Thaps_hclust_0494 |
 |
 |
6.7 |
15 |
60 |
lowFe_KTKB_Day3 | 0.133000 | -0.345 |
| Thaps_hclust_0494 |
 |
 |
6.7 |
15 |
60 |
lowFe_KTKB_Day5 | 0.146000 | -0.29 |
| Thaps_hclust_0494 |
 |
 |
6.7 |
15 |
60 |
BaP | 0.000370 | -1.55 |
| Thaps_hclust_0494 |
 |
 |
6.7 |
15 |
60 |
exponential_vs_stationary_24highlight | 0.109000 | -0.17 |
