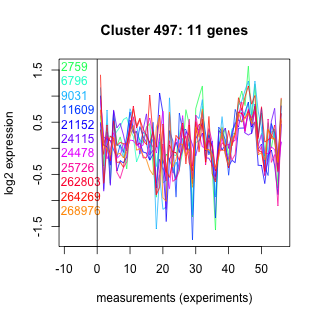
Thaps_hclust_0497 Hierarchical Clustering
Thalassiosira pseudonana
| Cluster Plot | Conditions Plot | Dendrogram |
|---|---|---|
 |
 |
 |
| GO ID | Go Term | p-value | q-value | Cluster |
|---|---|---|---|---|
| GO:0016567 | protein ubiquitination | 0.00255134 | 1 | Thaps_hclust_0497 |
| GO:0006629 | lipid metabolism | 0.0296321 | 1 | Thaps_hclust_0497 |
| GO:0007242 | intracellular signaling cascade | 0.0426852 | 1 | Thaps_hclust_0497 |
| GO:0006508 | proteolysis and peptidolysis | 0.264399 | 1 | Thaps_hclust_0497 |
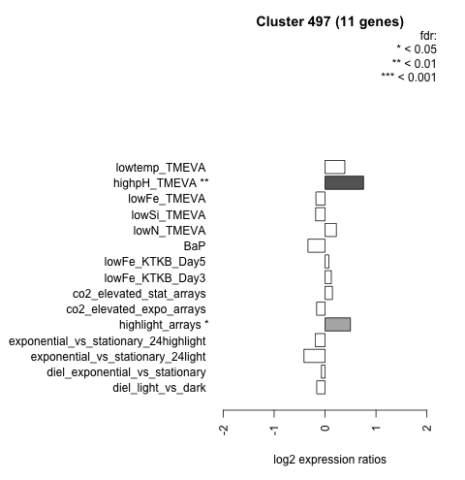
| Condition | Condition | Difference | FDR |
|---|---|---|---|
| diel_light_vs_dark | diel_light_vs_dark | -0.164 | 0.626 |
| lowFe_KTKB_Day3 | lowFe_KTKB_Day3 | 0.123 | 0.744 |
| lowFe_KTKB_Day5 | lowFe_KTKB_Day5 | 0.075 | 0.802 |
| BaP | BaP | -0.336 | 0.259 |
| exponential_vs_stationary_24highlight | exponential_vs_stationary_24highlight | -0.193 | 0.182 |
| co2_elevated_stat_arrays | co2_elevated_stat_arrays | 0.145 | 0.63 |
| lowtemp_TMEVA | lowtemp_TMEVA | 0.388 | 0.26 |
| highpH_TMEVA | highpH_TMEVA | 0.756 | 0.00309 |
| co2_elevated_expo_arrays | co2_elevated_expo_arrays | -0.166 | 0.487 |
| lowFe_TMEVA | lowFe_TMEVA | -0.180 | 0.626 |
| exponential_vs_stationary_24light | exponential_vs_stationary_24light | -0.415 | 0.314 |
| lowN_TMEVA | lowN_TMEVA | 0.223 | 0.605 |
| diel_exponential_vs_stationary | diel_exponential_vs_stationary | -0.072 | 0.804 |
| lowSi_TMEVA | lowSi_TMEVA | -0.186 | 0.893 |
| highlight_arrays | highlight_arrays | 0.498 | 0.0182 |