Hierarchical Clusters
Displaying 1801 - 1900 of 7500
| Title | Cluster Plot | Dendrogram | e-value | e-value | e-value | Condition | Condition FDR | Condition Difference |
|---|---|---|---|---|---|---|---|---|
| Thaps_hclust_0380 |
 |
 |
1.1 |
5 |
8.7 |
lowN_TMEVA | 0.761000 | 0.125 |
| Thaps_hclust_0380 |
 |
 |
1.1 |
5 |
8.7 |
diel_exponential_vs_stationary | 0.233000 | -0.252 |
| Thaps_hclust_0380 |
 |
 |
1.1 |
5 |
8.7 |
lowSi_TMEVA | 0.023200 | 0.984 |
| Thaps_hclust_0380 |
 |
 |
1.1 |
5 |
8.7 |
highlight_arrays | 0.005480 | 0.483 |
| Thaps_hclust_0380 |
 |
 |
1.1 |
5 |
8.7 |
diel_light_vs_dark | 0.004840 | 0.624 |
| Thaps_hclust_0380 |
 |
 |
1.1 |
5 |
8.7 |
lowFe_KTKB_Day3 | 0.478000 | -0.207 |
| Thaps_hclust_0380 |
 |
 |
1.1 |
5 |
8.7 |
lowFe_KTKB_Day5 | 0.902000 | 0.034 |
| Thaps_hclust_0380 |
 |
 |
1.1 |
5 |
8.7 |
BaP | 0.836000 | -0.0621 |
| Thaps_hclust_0380 |
 |
 |
1.1 |
5 |
8.7 |
exponential_vs_stationary_24highlight | 0.023300 | -0.267 |
| Thaps_hclust_0380 |
 |
 |
1.1 |
5 |
8.7 |
co2_elevated_stat_arrays | 0.432000 | 0.205 |
| Thaps_hclust_0380 |
 |
 |
1.1 |
5 |
8.7 |
lowtemp_TMEVA | 0.297000 | 0.302 |
| Thaps_hclust_0380 |
 |
 |
1.1 |
5 |
8.7 |
highpH_TMEVA | 0.108000 | 0.285 |
| Thaps_hclust_0380 |
 |
 |
1.1 |
5 |
8.7 |
co2_elevated_expo_arrays | 0.969000 | 0.0232 |
| Thaps_hclust_0380 |
 |
 |
1.1 |
5 |
8.7 |
lowFe_TMEVA | 0.001040 | 1.26 |
| Thaps_hclust_0380 |
 |
 |
1.1 |
5 |
8.7 |
exponential_vs_stationary_24light | 0.219000 | -0.438 |
| Title | Cluster Plot | Dendrogram | e-value | e-value | e-value | Condition | Condition FDR | Condition Difference |
|---|---|---|---|---|---|---|---|---|
| Thaps_hclust_0379 |
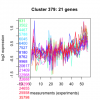 |
 |
0.00013 |
0.012 |
0.26 |
exponential_vs_stationary_24light | 0.684000 | -0.154 |
| Thaps_hclust_0379 |
 |
 |
0.00013 |
0.012 |
0.26 |
lowN_TMEVA | 0.699000 | 0.15 |
| Thaps_hclust_0379 |
 |
 |
0.00013 |
0.012 |
0.26 |
diel_exponential_vs_stationary | 0.083000 | -0.297 |
| Thaps_hclust_0379 |
 |
 |
0.00013 |
0.012 |
0.26 |
lowSi_TMEVA | 0.778000 | 0.26 |
| Thaps_hclust_0379 |
 |
 |
0.00013 |
0.012 |
0.26 |
highlight_arrays | 0.000847 | -0.467 |
| Thaps_hclust_0379 |
 |
 |
0.00013 |
0.012 |
0.26 |
diel_light_vs_dark | 0.032800 | 0.405 |
| Thaps_hclust_0379 |
 |
 |
0.00013 |
0.012 |
0.26 |
lowFe_KTKB_Day3 | 0.791000 | 0.0777 |
| Thaps_hclust_0379 |
 |
 |
0.00013 |
0.012 |
0.26 |
lowFe_KTKB_Day5 | 0.301000 | -0.206 |
| Thaps_hclust_0379 |
 |
 |
0.00013 |
0.012 |
0.26 |
BaP | 0.858000 | -0.0468 |
| Thaps_hclust_0379 |
 |
 |
0.00013 |
0.012 |
0.26 |
exponential_vs_stationary_24highlight | 0.821000 | -0.0266 |
| Thaps_hclust_0379 |
 |
 |
0.00013 |
0.012 |
0.26 |
co2_elevated_stat_arrays | 0.941000 | -0.0218 |
| Thaps_hclust_0379 |
 |
 |
0.00013 |
0.012 |
0.26 |
lowtemp_TMEVA | 0.394000 | -0.218 |
| Thaps_hclust_0379 |
 |
 |
0.00013 |
0.012 |
0.26 |
highpH_TMEVA | 0.002530 | -0.462 |
| Thaps_hclust_0379 |
 |
 |
0.00013 |
0.012 |
0.26 |
co2_elevated_expo_arrays | 0.934000 | -0.044 |
| Thaps_hclust_0379 |
 |
 |
0.00013 |
0.012 |
0.26 |
lowFe_TMEVA | 0.981000 | -0.0143 |
| Title | Cluster Plot | Dendrogram | e-value | e-value | e-value | Condition | Condition FDR | Condition Difference |
|---|---|---|---|---|---|---|---|---|
| Thaps_hclust_0378 |
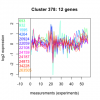 |
 |
0.0003 |
210 |
10 |
exponential_vs_stationary_24light | 0.684000 | 0.188 |
| Thaps_hclust_0378 |
 |
 |
0.0003 |
210 |
10 |
lowN_TMEVA | 0.695000 | 0.176 |
| Thaps_hclust_0378 |
 |
 |
0.0003 |
210 |
10 |
diel_exponential_vs_stationary | 0.402000 | -0.204 |
| Thaps_hclust_0378 |
 |
 |
0.0003 |
210 |
10 |
lowSi_TMEVA | 0.613000 | 0.377 |
| Thaps_hclust_0378 |
 |
 |
0.0003 |
210 |
10 |
highlight_arrays | 0.007890 | -0.508 |
| Thaps_hclust_0378 |
 |
 |
0.0003 |
210 |
10 |
diel_light_vs_dark | 0.001770 | 0.752 |
| Thaps_hclust_0378 |
 |
 |
0.0003 |
210 |
10 |
lowFe_KTKB_Day3 | 0.926000 | 0.0406 |
| Thaps_hclust_0378 |
 |
 |
0.0003 |
210 |
10 |
lowFe_KTKB_Day5 | 0.249000 | -0.304 |
| Thaps_hclust_0378 |
 |
 |
0.0003 |
210 |
10 |
BaP | 0.044500 | 0.553 |
| Thaps_hclust_0378 |
 |
 |
0.0003 |
210 |
10 |
exponential_vs_stationary_24highlight | 0.986000 | 0.0033 |
| Thaps_hclust_0378 |
 |
 |
0.0003 |
210 |
10 |
co2_elevated_stat_arrays | 0.861000 | 0.0537 |
| Thaps_hclust_0378 |
 |
 |
0.0003 |
210 |
10 |
lowtemp_TMEVA | 0.999000 | -0.00497 |
| Thaps_hclust_0378 |
 |
 |
0.0003 |
210 |
10 |
highpH_TMEVA | 0.074500 | -0.356 |
| Thaps_hclust_0378 |
 |
 |
0.0003 |
210 |
10 |
co2_elevated_expo_arrays | 0.903000 | 0.0599 |
| Thaps_hclust_0378 |
 |
 |
0.0003 |
210 |
10 |
lowFe_TMEVA | 0.300000 | 0.355 |
| Title | Cluster Plot | Dendrogram | e-value | e-value | e-value | Condition | Condition FDR | Condition Difference |
|---|---|---|---|---|---|---|---|---|
| Thaps_hclust_0377 |
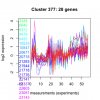 |
 |
0.00016 |
0.034 |
0.95 |
lowFe_TMEVA | 0.001040 | 0.589 |
| Thaps_hclust_0377 |
 |
 |
0.00016 |
0.034 |
0.95 |
exponential_vs_stationary_24light | 0.006250 | -0.699 |
| Thaps_hclust_0377 |
 |
 |
0.00016 |
0.034 |
0.95 |
lowN_TMEVA | 0.921000 | -0.0329 |
| Thaps_hclust_0377 |
 |
 |
0.00016 |
0.034 |
0.95 |
diel_exponential_vs_stationary | 0.000602 | -0.537 |
| Thaps_hclust_0377 |
 |
 |
0.00016 |
0.034 |
0.95 |
lowSi_TMEVA | 0.001350 | 0.932 |
| Thaps_hclust_0377 |
 |
 |
0.00016 |
0.034 |
0.95 |
highlight_arrays | 0.428000 | -0.115 |
| Thaps_hclust_0377 |
 |
 |
0.00016 |
0.034 |
0.95 |
diel_light_vs_dark | 0.000485 | 0.898 |
| Thaps_hclust_0377 |
 |
 |
0.00016 |
0.034 |
0.95 |
lowFe_KTKB_Day3 | 0.600000 | -0.12 |
| Thaps_hclust_0377 |
 |
 |
0.00016 |
0.034 |
0.95 |
lowFe_KTKB_Day5 | 0.920000 | 0.0197 |
| Thaps_hclust_0377 |
 |
 |
0.00016 |
0.034 |
0.95 |
BaP | 0.276000 | 0.208 |
| Thaps_hclust_0377 |
 |
 |
0.00016 |
0.034 |
0.95 |
exponential_vs_stationary_24highlight | 0.018400 | -0.203 |
| Thaps_hclust_0377 |
 |
 |
0.00016 |
0.034 |
0.95 |
co2_elevated_stat_arrays | 0.876000 | -0.0448 |
| Thaps_hclust_0377 |
 |
 |
0.00016 |
0.034 |
0.95 |
lowtemp_TMEVA | 0.031200 | 0.445 |
| Thaps_hclust_0377 |
 |
 |
0.00016 |
0.034 |
0.95 |
highpH_TMEVA | 0.000725 | -0.466 |
| Thaps_hclust_0377 |
 |
 |
0.00016 |
0.034 |
0.95 |
co2_elevated_expo_arrays | 0.802000 | -0.077 |
| Title | Cluster Plot | Dendrogram | e-value | e-value | e-value | Condition | Condition FDR | Condition Difference |
|---|---|---|---|---|---|---|---|---|
| Thaps_hclust_0376 |
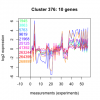 |
 |
0.42 |
3.3 |
2.4 |
co2_elevated_expo_arrays | 0.061000 | -0.363 |
| Thaps_hclust_0376 |
 |
 |
0.42 |
3.3 |
2.4 |
lowFe_TMEVA | 0.823000 | 0.105 |
| Thaps_hclust_0376 |
 |
 |
0.42 |
3.3 |
2.4 |
exponential_vs_stationary_24light | 0.000581 | -1.77 |
| Thaps_hclust_0376 |
 |
 |
0.42 |
3.3 |
2.4 |
lowN_TMEVA | 0.093300 | -0.756 |
| Thaps_hclust_0376 |
 |
 |
0.42 |
3.3 |
2.4 |
diel_exponential_vs_stationary | 0.000602 | -1.52 |
| Thaps_hclust_0376 |
 |
 |
0.42 |
3.3 |
2.4 |
lowSi_TMEVA | 0.001350 | 2.82 |
| Thaps_hclust_0376 |
 |
 |
0.42 |
3.3 |
2.4 |
highlight_arrays | 0.038100 | 0.446 |
| Thaps_hclust_0376 |
 |
 |
0.42 |
3.3 |
2.4 |
diel_light_vs_dark | 0.054000 | 0.545 |
| Thaps_hclust_0376 |
 |
 |
0.42 |
3.3 |
2.4 |
lowFe_KTKB_Day3 | 0.220000 | 0.407 |
| Thaps_hclust_0376 |
 |
 |
0.42 |
3.3 |
2.4 |
lowFe_KTKB_Day5 | 0.138000 | -0.436 |
| Thaps_hclust_0376 |
 |
 |
0.42 |
3.3 |
2.4 |
BaP | 0.000370 | -1.21 |
| Thaps_hclust_0376 |
 |
 |
0.42 |
3.3 |
2.4 |
exponential_vs_stationary_24highlight | 0.178000 | -0.201 |
| Thaps_hclust_0376 |
 |
 |
0.42 |
3.3 |
2.4 |
co2_elevated_stat_arrays | 0.169000 | -0.388 |
| Thaps_hclust_0376 |
 |
 |
0.42 |
3.3 |
2.4 |
lowtemp_TMEVA | 0.067000 | -0.66 |
| Thaps_hclust_0376 |
 |
 |
0.42 |
3.3 |
2.4 |
highpH_TMEVA | 0.038400 | -0.456 |
| Title | Cluster Plot | Dendrogram | e-value | e-value | e-value | Condition | Condition FDR | Condition Difference |
|---|---|---|---|---|---|---|---|---|
| Thaps_hclust_0375 |
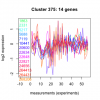 |
 |
1.8 |
2.9 |
40 |
highpH_TMEVA | 0.758000 | -0.0706 |
| Thaps_hclust_0375 |
 |
 |
1.8 |
2.9 |
40 |
co2_elevated_expo_arrays | 0.796000 | 0.0905 |
| Thaps_hclust_0375 |
 |
 |
1.8 |
2.9 |
40 |
lowFe_TMEVA | 0.978000 | -0.0169 |
| Thaps_hclust_0375 |
 |
 |
1.8 |
2.9 |
40 |
exponential_vs_stationary_24light | 0.800000 | 0.123 |
| Thaps_hclust_0375 |
 |
 |
1.8 |
2.9 |
40 |
lowN_TMEVA | 0.761000 | -0.134 |
| Thaps_hclust_0375 |
 |
 |
1.8 |
2.9 |
40 |
diel_exponential_vs_stationary | 0.349000 | -0.213 |
| Thaps_hclust_0375 |
 |
 |
1.8 |
2.9 |
40 |
lowSi_TMEVA | 1.000000 | -0.0459 |
| Thaps_hclust_0375 |
 |
 |
1.8 |
2.9 |
40 |
highlight_arrays | 0.860000 | 0.037 |
| Thaps_hclust_0375 |
 |
 |
1.8 |
2.9 |
40 |
diel_light_vs_dark | 0.015200 | 0.575 |
| Thaps_hclust_0375 |
 |
 |
1.8 |
2.9 |
40 |
lowFe_KTKB_Day3 | 0.353000 | -0.273 |
| Thaps_hclust_0375 |
 |
 |
1.8 |
2.9 |
40 |
lowFe_KTKB_Day5 | 0.239000 | -0.291 |
| Thaps_hclust_0375 |
 |
 |
1.8 |
2.9 |
40 |
BaP | 0.044400 | -0.499 |
| Thaps_hclust_0375 |
 |
 |
1.8 |
2.9 |
40 |
exponential_vs_stationary_24highlight | 0.517000 | -0.0894 |
| Thaps_hclust_0375 |
 |
 |
1.8 |
2.9 |
40 |
co2_elevated_stat_arrays | 0.951000 | -0.0179 |
| Thaps_hclust_0375 |
 |
 |
1.8 |
2.9 |
40 |
lowtemp_TMEVA | 0.619000 | -0.156 |
| Title | Cluster Plot | Dendrogram | e-value | e-value | e-value | Condition | Condition FDR | Condition Difference |
|---|---|---|---|---|---|---|---|---|
| Thaps_hclust_0374 |
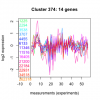 |
 |
1.4 |
19 |
50 |
lowtemp_TMEVA | 0.385000 | 0.261 |
| Thaps_hclust_0374 |
 |
 |
1.4 |
19 |
50 |
highpH_TMEVA | 0.187000 | -0.239 |
| Thaps_hclust_0374 |
 |
 |
1.4 |
19 |
50 |
co2_elevated_expo_arrays | 0.646000 | 0.123 |
| Thaps_hclust_0374 |
 |
 |
1.4 |
19 |
50 |
lowFe_TMEVA | 0.769000 | -0.122 |
| Thaps_hclust_0374 |
 |
 |
1.4 |
19 |
50 |
exponential_vs_stationary_24light | 0.900000 | 0.0564 |
| Thaps_hclust_0374 |
 |
 |
1.4 |
19 |
50 |
lowN_TMEVA | 0.874000 | 0.0548 |
| Thaps_hclust_0374 |
 |
 |
1.4 |
19 |
50 |
diel_exponential_vs_stationary | 0.014900 | -0.502 |
| Thaps_hclust_0374 |
 |
 |
1.4 |
19 |
50 |
lowSi_TMEVA | 0.997000 | 0.0866 |
| Thaps_hclust_0374 |
 |
 |
1.4 |
19 |
50 |
highlight_arrays | 0.760000 | -0.0661 |
| Thaps_hclust_0374 |
 |
 |
1.4 |
19 |
50 |
diel_light_vs_dark | 0.007140 | 0.634 |
